
Power Mech Projects bags Rs. 110.57 Cr order for O&M of 400 MW captive power plant at Dangote, Nigeria.
Posts in category Value Pickr
Protean EGov Technologies Ltd – A Play on the ONDC, Digital Policies (06-08-2024)
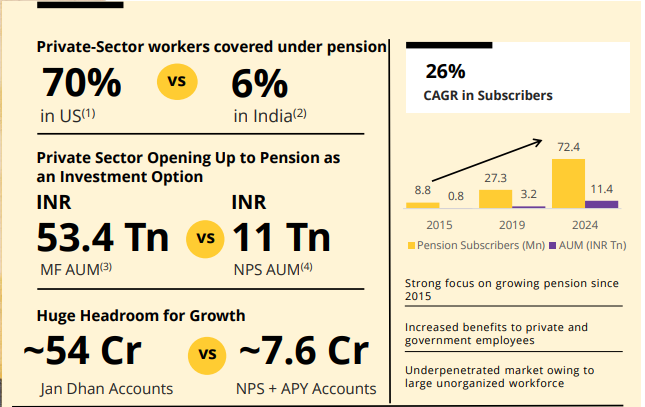
India is among the countries with the lowest per capita pension assets in the world.
Large Headroom for Growth
Sree Rayalaseema Hi-Strength Hypo Ltd (05-08-2024)
SRHHL does talk about reducing the environmental impact of their production via the electrolysis method.
Here are some quotes from the 2023 Annual Report (Source):
“Green Hydrogen production from the electrolysis of water is being planned to reduce
the environmental impact of present route of Hydrogen production.”
“A proposal is being reviewed in order to utilize Chlorine generated from the propsed
Sodium Metal Plant Electrolyzers in MOL preparation section of Cal Hypo Plant.”
Further, a 2018 Environmental Impact Report of the Parent, TGV SRAAC (Source), also talks about electrolysis methods (See section ‘Electrolysis of Brine’ for example). Unless I’m mistaken, the electrochlorination of Cal Hypo involves passing current through salt water or ‘brine’.
I am, by no means, an expert in Chemistry. So correct me if I’m wrong. But it seems to me like the TGV group does have the technology to implement electrolysis methods in its plants as required.
Sanofi india ltd (05-08-2024)
Let’s break down the provided financial data and analysis for the companies Sanofi India Ltd., Torrent Pharma, and Eris Lifesciences. The information is presented in various tables that include growth metrics, balance sheet data, profit and loss accounts, cash flow statements, and key financial ratios. I will explain each section, define the technical terms, and provide a brief analysis.
Growth Table
Metrics:
- Share Price CAGR (Compound Annual Growth Rate): This measures the annual growth rate of the share price over a specified period.
- 1yr: -5.57% indicates a decline in the share price over the past year.
- 3yr: -7.52% shows a decline over three years.
- 10yr: 8.57% shows a positive growth over ten years.
- TTM EPS CAGR (Trailing Twelve Months Earnings Per Share CAGR): This measures the growth rate of earnings per share over time.
- 1yr: -7.95% indicates a decrease in EPS over the last year.
- 3yr: -3.90% suggests a slight decline over three years.
- 10yr: 6.84% indicates positive growth over a decade.
- PE CAGR (Price to Earnings CAGR): The growth rate of the PE ratio over time.
- 1yr: 2.58% shows a slight increase in the PE ratio.
- 3yr: -3.77% indicates a decrease over three years.
- 10yr: 1.62% suggests moderate growth over ten years.
- CFO CAGR (Cash Flow from Operations CAGR): Growth rate of cash generated from operations.
- 1yr: -42.21% shows a significant decline in cash flow from operations over the last year.
- 3yr: -27.76% indicates a substantial decline over three years.
- 10yr: -1.67% suggests a slight decrease over ten years.
Balance Sheet
The balance sheet provides a snapshot of a company’s financial position, including assets, liabilities, and equity.
Assets
- Total Assets: Total resources owned by the company.
- Dec’15: 2,405 Cr. indicates the total asset value in December 2015.
- Jun’24: 1,360 Cr. shows a decrease in total assets as of June 2024.
- Non-Current Assets: Long-term investments and physical assets.
- Dec’15: 1,041 Cr. to Jun’24: 484 Cr. shows a significant reduction.
- Current Assets: Assets expected to be converted to cash within a year.
- Dec’15: 1,244 Cr. to Jun’24: 877 Cr. indicates fluctuations in liquidity.
Liabilities
- Total Liabilities: Obligations the company must pay.
- Remains consistent with the total assets over the years, indicating balanced accounting.
Profit & Loss Statement
This statement provides insights into the company’s revenue, expenses, and profitability over time.
Key Figures:
- Sales: Revenue from goods/services.
- Dec’15: 2,193 Cr. to TTM: 2,604 Cr. indicates growth in sales.
- Operating Expenses: Costs associated with running the business.
- Dec’15: 1,734 Cr. to TTM: 1,874 Cr. shows a controlled increase in costs.
- Operating Profit: Earnings from core operations.
- Dec’15: 459 Cr. to TTM: 731 Cr. reflects improved operational efficiency.
- Net Profit: The bottom line profit after all expenses.
- Dec’15: 322 Cr. to TTM: 530 Cr. indicates an overall increase in profitability.
Cash Flow Statement
The cash flow statement highlights the inflows and outflows of cash, categorized by operating, investing, and financing activities.
Key Metrics:
- Cash from Operating Activity: Cash generated from core operations.
- Dec’15: 213 Cr. to Jun’24: 334 Cr. suggests fluctuating cash generation.
- Cash from Investing Activity: Cash used for investments.
- Dec’15: 35.9 Cr. to Jun’24: -18 Cr. shows varying investment activity.
- Cash from Financing Activity: Cash raised through financing.
- Dec’15: -147 Cr. to Jun’24: -393 Cr. indicates financing outflows, possibly for debt repayment or dividends.
- Net Cash Flow: Overall cash movement.
- Dec’15: 102 Cr. to Jun’24: -77.6 Cr. suggests periods of cash inflow and outflow.
Ratios
Ratios provide a quantitative analysis of financial performance and health.
Operational Ratios:
- Quick Ratio: Measures short-term liquidity.
- Dec’15: 1.20 to Dec’23: 0.97 indicates declining liquidity.
- Current Ratio: Measures the ability to pay short-term obligations.
- Dec’15: 1.93 to Dec’23: 1.23 suggests potential liquidity issues.
- Interest Coverage Ratio: Ability to meet interest payments.
- Dec’15: 777 to Dec’23: 499 shows decreased ability to cover interest.
- Fixed Asset Turnover: Efficiency in using fixed assets to generate sales.
- Dec’15: 1.75 to Dec’23: 5.17 indicates improved asset utilization.
- Cash Conversion Cycle: Efficiency in converting inventory and receivables into cash.
- Dec’15: 41.66 to Dec’23: -16.41 suggests better cash management.
- Debt to Equity Ratio: Proportion of debt to shareholder equity.
- Consistently 0.00 shows no reliance on debt.
Profitability Ratios:
- Gross Margin (%): Profitability after direct costs.
- Dec’15: 56.01% to Dec’23: 57.88% indicates stable gross profit.
- Op Profit Margin (%): Profitability from operations.
- Dec’15: 20.39% to Dec’23: 30.49% reflects improved operational efficiency.
- Net Profit Margin (%): Overall profitability.
- Dec’15: 13.33% to Dec’23: 21.16% indicates stronger net profit.
- ROCE (%): Return on capital employed.
- Dec’15: 19.50% to Dec’23: 38.26% shows efficient capital use.
- Return on Assets (%): Return on total assets.
- Dec’15: 11.83% to Dec’23: 12.83% reflects consistent asset profitability.
- ROE (%): Return on equity.
- Dec’15: 17.74% to Dec’23: 59.40% indicates strong equity returns.
Valuation Ratios:
- P/E (Price to Earnings): Valuation based on earnings.
- Dec’15: 31.39 to Dec’23: 30.76 shows slight changes in market valuation.
- Price to Book: Valuation based on book value.
- Dec’15: 5.58 to Dec’23: 19.59 indicates increased market valuation.
- EV/EBITDA: Valuation of enterprise value to earnings.
- Dec’15: 19.36 to Dec’23: 20.88 shows stable valuation.
- Dividend Yield (%): Dividend income relative to share price.
- Dec’15: 1.25% to Dec’23: 2.07% suggests moderate dividend returns.
Conclusion
The financial analysis of Sanofi India Ltd., Torrent Pharma, and Eris Lifesciences shows a mixed performance over the years:
- Growth Metrics: Indicate fluctuating growth in share price and EPS, with cash flow challenges.
- Balance Sheet: Assets and liabilities show a reduction over time, impacting financial stability.
- Profit & Loss: Sales and net profit have generally improved, indicating effective cost management and profitability.
- Cash Flow: Cash flow from operations has been inconsistent, with cash flow challenges in recent years.
- Ratios: Profitability and operational efficiency have improved, but liquidity ratios suggest potential short-term challenges.
This analysis suggests that while the companies have shown resilience and profitability improvements, there are areas such as liquidity and cash flow management that require attention.
SANOFI India Ltd – A richly valued MNC Pharma Co (05-08-2024)
Let’s break down the provided financial data and analysis for the companies Sanofi India Ltd., Torrent Pharma, and Eris Lifesciences. The information is presented in various tables that include growth metrics, balance sheet data, profit and loss accounts, cash flow statements, and key financial ratios. I will explain each section, define the technical terms, and provide a brief analysis.
Growth Table
Metrics:
- Share Price CAGR (Compound Annual Growth Rate): This measures the annual growth rate of the share price over a specified period.
- 1yr: -5.57% indicates a decline in the share price over the past year.
- 3yr: -7.52% shows a decline over three years.
- 10yr: 8.57% shows a positive growth over ten years.
- TTM EPS CAGR (Trailing Twelve Months Earnings Per Share CAGR): This measures the growth rate of earnings per share over time.
- 1yr: -7.95% indicates a decrease in EPS over the last year.
- 3yr: -3.90% suggests a slight decline over three years.
- 10yr: 6.84% indicates positive growth over a decade.
- PE CAGR (Price to Earnings CAGR): The growth rate of the PE ratio over time.
- 1yr: 2.58% shows a slight increase in the PE ratio.
- 3yr: -3.77% indicates a decrease over three years.
- 10yr: 1.62% suggests moderate growth over ten years.
- CFO CAGR (Cash Flow from Operations CAGR): Growth rate of cash generated from operations.
- 1yr: -42.21% shows a significant decline in cash flow from operations over the last year.
- 3yr: -27.76% indicates a substantial decline over three years.
- 10yr: -1.67% suggests a slight decrease over ten years.
Balance Sheet
The balance sheet provides a snapshot of a company’s financial position, including assets, liabilities, and equity.
Assets
- Total Assets: Total resources owned by the company.
- Dec’15: 2,405 Cr. indicates the total asset value in December 2015.
- Jun’24: 1,360 Cr. shows a decrease in total assets as of June 2024.
- Non-Current Assets: Long-term investments and physical assets.
- Dec’15: 1,041 Cr. to Jun’24: 484 Cr. shows a significant reduction.
- Current Assets: Assets expected to be converted to cash within a year.
- Dec’15: 1,244 Cr. to Jun’24: 877 Cr. indicates fluctuations in liquidity.
Liabilities
- Total Liabilities: Obligations the company must pay.
- Remains consistent with the total assets over the years, indicating balanced accounting.
Profit & Loss Statement
This statement provides insights into the company’s revenue, expenses, and profitability over time.
Key Figures:
- Sales: Revenue from goods/services.
- Dec’15: 2,193 Cr. to TTM: 2,604 Cr. indicates growth in sales.
- Operating Expenses: Costs associated with running the business.
- Dec’15: 1,734 Cr. to TTM: 1,874 Cr. shows a controlled increase in costs.
- Operating Profit: Earnings from core operations.
- Dec’15: 459 Cr. to TTM: 731 Cr. reflects improved operational efficiency.
- Net Profit: The bottom line profit after all expenses.
- Dec’15: 322 Cr. to TTM: 530 Cr. indicates an overall increase in profitability.
Cash Flow Statement
The cash flow statement highlights the inflows and outflows of cash, categorized by operating, investing, and financing activities.
Key Metrics:
- Cash from Operating Activity: Cash generated from core operations.
- Dec’15: 213 Cr. to Jun’24: 334 Cr. suggests fluctuating cash generation.
- Cash from Investing Activity: Cash used for investments.
- Dec’15: 35.9 Cr. to Jun’24: -18 Cr. shows varying investment activity.
- Cash from Financing Activity: Cash raised through financing.
- Dec’15: -147 Cr. to Jun’24: -393 Cr. indicates financing outflows, possibly for debt repayment or dividends.
- Net Cash Flow: Overall cash movement.
- Dec’15: 102 Cr. to Jun’24: -77.6 Cr. suggests periods of cash inflow and outflow.
Ratios
Ratios provide a quantitative analysis of financial performance and health.
Operational Ratios:
- Quick Ratio: Measures short-term liquidity.
- Dec’15: 1.20 to Dec’23: 0.97 indicates declining liquidity.
- Current Ratio: Measures the ability to pay short-term obligations.
- Dec’15: 1.93 to Dec’23: 1.23 suggests potential liquidity issues.
- Interest Coverage Ratio: Ability to meet interest payments.
- Dec’15: 777 to Dec’23: 499 shows decreased ability to cover interest.
- Fixed Asset Turnover: Efficiency in using fixed assets to generate sales.
- Dec’15: 1.75 to Dec’23: 5.17 indicates improved asset utilization.
- Cash Conversion Cycle: Efficiency in converting inventory and receivables into cash.
- Dec’15: 41.66 to Dec’23: -16.41 suggests better cash management.
- Debt to Equity Ratio: Proportion of debt to shareholder equity.
- Consistently 0.00 shows no reliance on debt.
Profitability Ratios:
- Gross Margin (%): Profitability after direct costs.
- Dec’15: 56.01% to Dec’23: 57.88% indicates stable gross profit.
- Op Profit Margin (%): Profitability from operations.
- Dec’15: 20.39% to Dec’23: 30.49% reflects improved operational efficiency.
- Net Profit Margin (%): Overall profitability.
- Dec’15: 13.33% to Dec’23: 21.16% indicates stronger net profit.
- ROCE (%): Return on capital employed.
- Dec’15: 19.50% to Dec’23: 38.26% shows efficient capital use.
- Return on Assets (%): Return on total assets.
- Dec’15: 11.83% to Dec’23: 12.83% reflects consistent asset profitability.
- ROE (%): Return on equity.
- Dec’15: 17.74% to Dec’23: 59.40% indicates strong equity returns.
Valuation Ratios:
- P/E (Price to Earnings): Valuation based on earnings.
- Dec’15: 31.39 to Dec’23: 30.76 shows slight changes in market valuation.
- Price to Book: Valuation based on book value.
- Dec’15: 5.58 to Dec’23: 19.59 indicates increased market valuation.
- EV/EBITDA: Valuation of enterprise value to earnings.
- Dec’15: 19.36 to Dec’23: 20.88 shows stable valuation.
- Dividend Yield (%): Dividend income relative to share price.
- Dec’15: 1.25% to Dec’23: 2.07% suggests moderate dividend returns.
Conclusion
The financial analysis of Sanofi India Ltd., Torrent Pharma, and Eris Lifesciences shows a mixed performance over the years:
- Growth Metrics: Indicate fluctuating growth in share price and EPS, with cash flow challenges.
- Balance Sheet: Assets and liabilities show a reduction over time, impacting financial stability.
- Profit & Loss: Sales and net profit have generally improved, indicating effective cost management and profitability.
- Cash Flow: Cash flow from operations has been inconsistent, with cash flow challenges in recent years.
- Ratios: Profitability and operational efficiency have improved, but liquidity ratios suggest potential short-term challenges.
This analysis suggests that while the companies have shown resilience and profitability improvements, there are areas such as liquidity and cash flow management that require attention.
Buy Unlisted Shares (05-08-2024)
No. of employees is ~22 and salaries expense is INR 1.23 cr. Not really sure if they’ve employed off-role employees.
If yes, then this looks like they dont need skilled manpower (avg salary comes to ~6LPA for on role and rest could be off role)
Electricity expense seems to be very low
Power Mech Projects – Not a typical Power Infra Company (05-08-2024)
A good steady flow of orders –
Macpower CNC Machines: Manufacturing a Strong Growth? (05-08-2024)
Hi everyone,
I wanted to share my thoughts on MACPOWER CNC at its current valuation. Recently, on July 26th, 2024, I had the privilege of visiting their plant as an individual investor. I was incredibly impressed by Mr. Rupesh Bhai Mehta, who is a true champion and held leadership positions in many group including being at the helm of Indian machine tools manufactures association as a director over a decade. I guess that helps build vision.
1 Order Book: On page 5 of the last quarter’s investor presentation, you’ll see that the order book (₹262 crores) is already higher than the revenue from the last fiscal year (₹240 crores). For further updates on the “RATE of increase in order book,” I highly recommend listening to the FY24 Q4 concall – some special mentions there.
2 Future Machines Order: The number of future machine orders is already 44% higher than last year.
3 Expansion: Against selling 1,235 machines last year, the expansion to 2,000 machines is already in place and could go up to 2,200 machines after resolving bottlenecks – that’s a 60% growth. ( Part of investor presentation. )
4 Demand: Demand is abnormally high ( con-call and my visit + industry touch points ) , and the company is selective about the businesses they onboard. They are keen on defence and aerospace projects due to higher margins and future triggers mentioned below. Clearly a sellers Market.
5 Land Acquisition: The company is about to be awarded a 35-acre land at a token rate, which is 1/2 of the Jantri rate (current circle rate is about ₹25 lakhs), making the land worth around ₹4 crores.
6 Future Projects: The percentage of future defence and high-value projects is increasing rapidly.
7 Debt-Free: The company is debt-free and management is averse to taking loans.
8 Dividend: Management hasn’t taken a dividend for the last two periods. Highest salary received by Mr. Rupesh bhai Mehta at 3 lacs per month only. Says a lot about the culture.
9 Cost Efficiency: MACPOWER is the lowest-cost manufacturer in India, benefiting from operating leverage and EBITDA expansion as scale increases.
10. FCF of 50 crores.
11. Backward integration in process to increase margins and reduce dependency on outside vendors.
Future fundamental Triggers:
1 GST Refund: Under the Gujarat defence and aerospace policy 2016, 8% of GST will be refunded to the company in the new plant ( 1.5 years away ).
2 Defence and Aerospace Projects: 50% of projects will be in defence and aerospace, which are higher-margin products. 50% can be anything else. This clause is valid for first 5 years only.
3 R&D Incentives: The government will return back 200% of the company’s R&D expenditure for their Rajkot and Bangalore research centers.
4 Capex: The new project’s capex cost could be around ₹60 crores, potentially financed through internal accruals if capex is executed in phases, as the company’s FCF is around ₹50 crores and possibly over ₹100 crores by year-end.
5 Expansion Plan: If high demand continues, the company may do a QIP to announce a massive expansion at the new facility and do a one time capex instead.
6 Multinational Tie-Up: A potential tie-up with a multinational company for CDMO is expected by the end of this financial year, which could or i should say may elevate MACPOWER from small cap to midcap to large-cap status over long periods of time. ( Network effects – specially export will then become a deep moat + technological advancement in a precision industry business )
7 Electricity Subsidy: The new plant will benefit from serious subsidies on electricity costs. Currently they have reduced 80% of their industrial electricity bills by installing solar panels.
8 Company definitely in a sellers Market.
Base Case Scenario:
In my humble opinion to see a 50% increase in revenues from last year, taking revenues to ₹360 crores with EBITDA margins of 17%, resulting in a PAT of around ₹45 crores and forward valuations close to a PE of 31 types.
Anything above a PAT of 50 Crores i would consider a Bull Case scenario.
Potential Risks:
1 Market Fluctuations: Economic downturns or market volatility could impact the demand for CNC machines. Highly unlikely though in current market conditions.
2 Regulatory Changes: Changes in government policies or regulations, especially those related to defence and aerospace sectors, could affect the company’s operations and profitability.
3 Execution Risks: Delays or issues in executing the expansion plans and bottleneck resolutions could impact growth projections.
4 Technological Advancements: Rapid advancements in technology could render current products obsolete if the company fails to keep up with innovation. Specially for new machines being announced in IMPEX Banglore event 2025 for EMS and other precision engineering sectors etc.
5 Dependency on Key Personnel: The company’s performance is significantly influenced by key personnel like in most small cap companies, and any change in leadership could impact strategic direction and execution.
Exit Strategy –
The sector has tailwinds, and the business has the strength to sustain multiple years of growth. I prefer to wait until either the EPS peaks or the valuation becomes unsustainable before considering an exit or due to cause of delayed or poor execution that would hamper growth at higher valuations.
My multi-bagger Learning’s from the reading the book named the little book the creates wealth by Dorsey in the same week and its application to my visit :
1 Look for “ rate of change “ of revenue/operating leverage/deleveraging etc etc. Rate of change often matters.
2 Having a sound management is good but good management, good execution, great product and good team is NOT a long term moat.
3 4 sources of structural Moats are network effects ( An international tie up to use their existing network for CDMO ), cost advantages ( exists in MACPOWER cnc ) and will get better with scale, Intangible assets ( Not applicable ) and customer switching ( N.A. ), A Better location ( The new plant around 35 acres that may be announced soon and its benefits mentioned above )
4 Supple side dominance with 7-9 companies owning up to 90% of indian market share. Focus on Fish to Pond ratio and not on the absolute size of the fish. A big fish in a small pond is better than a big fish in a big pond.
5 Champion capital allocator – Debt free, debt averse, pays dividend ( but refuses to take dividend for himself – refused a crore twice in the past )
6 Broadly – Moats are more absolute in nature than relative. An example of this is that the fourth best company in a structurally attractive industry may very well have a wider and deeper Moat than the best company in a brutally competitive industry.
Second order consequences and self talk :
1 To see if my company has economic moat first see its past track record of generating returns on capital. Possibly, a strong ROC over long enough periods of time may reflect a company may have a moat and poor returns may reflect ordinary execution on ground. Watch execution like a hawk.
2 If the answer to the above question is yes, ask yourself how the company will maintain them. If over long periods of time you can’t identify specific reason/s why the ROC will stay strong the company likely does not have a Moat. Keep questioning yourself.
3 If you can identify a moat, think about how strong it is and how long it will last. Some moats last for decades others are less durable.
Why are the above points important to me ?
1 My companies value is of all the cash it will generate in the future. That’s it !
2 4 most important factor that effect the valuation of my company is how much cash it will generate in the further ( rate of change of growth ), the certainty attached to those estimated cash flows ( risks ), The amount of investment needed to run the business ( ROC ) and the length of time for which the company can keep competitors at bay ( competing advantage /economic moat )
I urge everyone to study the con-call,and put independent work to build independent conviction. I currently hold a 1% stake in this business. I am certainly biased and this is just for educational purposes as i am here to share my learning’s with the community and learn to from the community too.
Always beware of which ‘E’to use when calculation of P/E only because forecasts don’t always come true. The best ‘E’ to use is your own; be cautious or reserved of possible future ‘E’ it’s your own hard earned money, build MoS. Be responsible.
Hope this added value and help in your own journey.
Some helpful links :
-
Q2FY24, Q3FY24 and Q4FY24 con calls spill the beans
MACPOWER CNC – In a sellers Market (05-08-2024)
Hi everyone,
I wanted to share my thoughts on MACPOWER CNC at its current valuation. Recently, on July 26th, 2024, I had the privilege of visiting their plant as an individual investor. I was incredibly impressed by Mr. Rupesh Bhai Mehta, who is a true champion and held leadership positions in many group including being at the helm of Indian machine tools manufactures association as a director over a decade. I guess that helps build vision.
1 Order Book: On page 5 of the last quarter’s investor presentation, you’ll see that the order book (₹262 crores) is already higher than the revenue from the last fiscal year (₹240 crores). For further updates on the “RATE of increase in order book,” I highly recommend listening to the FY24 Q4 concall – some special mentions there.
2 Future Machines Order: The number of future machine orders is already 44% higher than last year.
3 Expansion: Against selling 1,235 machines last year, the expansion to 2,000 machines is already in place and could go up to 2,200 machines after resolving bottlenecks – that’s a 60% growth. ( Part of investor presentation. )
4 Demand: Demand is abnormally high ( con-call and my visit + industry touch points ) , and the company is selective about the businesses they onboard. They are keen on defence and aerospace projects due to higher margins and future triggers mentioned below. Clearly a sellers Market.
5 Land Acquisition: The company is about to be awarded a 35-acre land at a token rate, which is 1/2 of the Jantri rate (current circle rate is about ₹25 lakhs), making the land worth around ₹4 crores.
6 Future Projects: The percentage of future defence and high-value projects is increasing rapidly.
7 Debt-Free: The company is debt-free and management is averse to taking loans.
8 Dividend: Management hasn’t taken a dividend for the last two periods. Highest salary received by Mr. Rupesh bhai Mehta at 3 lacs per month only. Says a lot about the culture.
9 Cost Efficiency: MACPOWER is the lowest-cost manufacturer in India, benefiting from operating leverage and EBITDA expansion as scale increases.
10. FCF of 50 crores.
Future fundamental Triggers:
1 GST Refund: Under the Gujarat defence and aerospace policy 2016, 8% of GST will be refunded to the company in the new plant ( 1.5 years away ).
2 Defence and Aerospace Projects: 50% of projects will be in defence and aerospace, which are higher-margin products. 50% can be anything else. This clause is valid for first 5 years only.
3 R&D Incentives: The government will return back 200% of the company’s R&D expenditure for their Rajkot and Bangalore research centers.
4 Capex: The new project’s capex cost could be around ₹60 crores, potentially financed through internal accruals if capex is executed in phases, as the company’s FCF is around ₹50 crores and possibly over ₹100 crores by year-end.
5 Expansion Plan: If high demand continues, the company may do a QIP to announce a massive expansion at the new facility and do a one time capex instead.
6 Multinational Tie-Up: A potential tie-up with a multinational company for CDMO is expected by the end of this financial year, which could or i should say may elevate MACPOWER from small cap to midcap to large-cap status over long periods of time. ( Network effects – specially export will then become a deep moat)
7 Electricity Subsidy: The new plant will benefit from serious subsidies on electricity costs. Currently they have reduced 80% of their industrial electricity bills by installing solar panels.
8 Company definitely in a sellers Market.
Base Case Scenario:
In my humble opinion to see a 50% increase in revenues from last year, taking revenues to ₹360 crores with EBITDA margins of 17%, resulting in a PAT of around ₹45 crores and forward valuations close to a PE of 31 types.
Anything above a PAT of 50 Crores i would consider a Bull Case scenario.
Potential Risks:
1 Market Fluctuations: Economic downturns or market volatility could impact the demand for CNC machines. Highly unlikely though in current market conditions.
2 Regulatory Changes: Changes in government policies or regulations, especially those related to defence and aerospace sectors, could affect the company’s operations and profitability.
3 Execution Risks: Delays or issues in executing the expansion plans and bottleneck resolutions could impact growth projections.
4 Technological Advancements: Rapid advancements in technology could render current products obsolete if the company fails to keep up with innovation. Specially for new machines being announced in IMPEX Banglore event 2025 for EMS and other precision engineering sectors etc.
5 Dependency on Key Personnel: The company’s performance is significantly influenced by key personnel like in most small cap companies, and any change in leadership could impact strategic direction and execution.
Exit Strategy –
The sector has tailwinds, and the business has the strength to sustain multiple years of growth. I prefer to wait until either the EPS peaks or the valuation becomes unsustainable before considering an exit or due to cause of delayed or poor execution that would hamper growth at higher valuations.
My multi-bagger Learning’s from the reading the book named the little book the creates wealth by Dorsey in the same week and its application to my visit :
1 Look for “ rate of change “ of revenue/operating leverage/deleveraging etc etc. Rate of change often matters.
2 Having a sound management is good but good management, good execution, great product and good team is NOT a long term moat.
3 4 sources of structural Moats are network effects ( An international tie up to use their existing network for CDMO ), cost advantages ( exists in MACPOWER cnc ) and will get better with scale, Intangible assets ( Not applicable ) and customer switching ( N.A. ), A Better location ( The new plant around 35 acres that may be announced soon and its benefits mentioned above )
4 Supple side dominance with 7-9 companies owning up to 90% of indian market share. Focus on Fish to Pond ratio and not on the absolute size of the fish. A big fish in a small pond is better than a big fish in a big pond.
5 Champion capital allocator – Debt free, debt averse, pays dividend ( but refuses to take dividend for himself – refused a crore twice in the past )
6 Broadly – Moats are more absolute in nature than relative. An example of this is that the fourth best company in a structurally attractive industry may very well have a wider and deeper Moat than the best company in a brutally competitive industry.
Second order consequences and self talk :
1 To see if my company has economic moat first see its past track record of generating returns on capital. Possibly, a strong ROC over long enough periods of time may reflect a company may have a moat and poor returns may reflect ordinary execution on ground. Watch execution like a hawk.
2 If the answer to the above question is yes, ask yourself how the company will maintain them. If over long periods of time you can’t identify specific reason/s why the ROC will stay strong the company likely does not have a Moat. Keep questioning yourself.
3 If you can identify a moat, think about how strong it is and how long it will last. Some moats last for decades others are less durable.
Why are the above points important to me ?
1 My companies value is of all the cash it will generate in the future. That’s it !
2 4 most important factor that effect the valuation of my company is how much cash it will generate in the further ( rate of change of growth ), the certainty attached to those estimated cash flows ( risks ), The amount of investment needed to run the business ( ROC ) and the length of time for which the company can keep competitors at bay ( competing advantage /economic moat )
I urge everyone to study the con-call,and put independent work to build independent conviction. I currently hold a 1% stake in this business. I am certainly biased and this is just for educational purposes as i am here to share my learning’s with the community and learn to from the community too.
Always beware of which ‘E’to use when calculation of P/E only because forecasts don’t always come true. The best ‘E’ to use is your own; be cautious or reserved of possible future ‘E’ it’s your own hard earned money, build MoS. Be responsible.
Hope this added value and help in your own journey.
Some helpful links :
-
Q2FY24, Q3FY24 and Q4FY24 con calls spill the beans