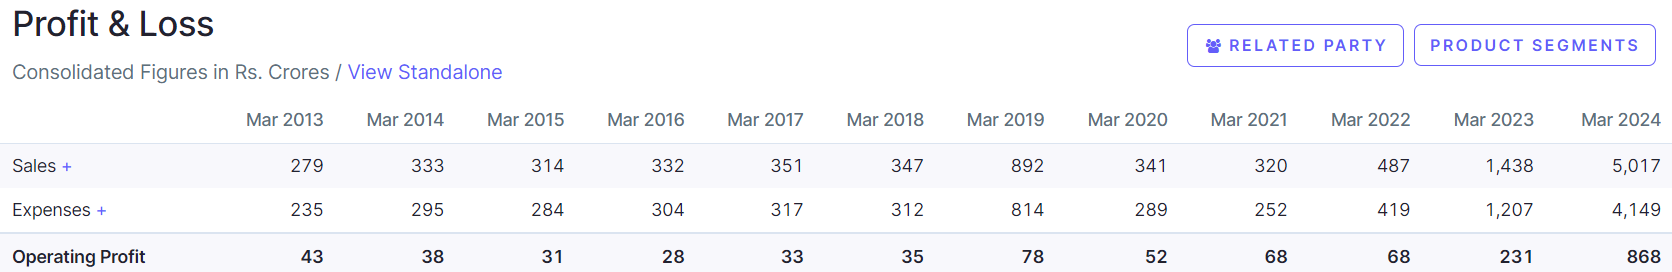
If you notice in 2024…sudden rise by around 300 %…what is the trigger to raise sales? Any idea
Previous yrs to 2024…what changes made by management to get this much big push

If you notice in 2024…sudden rise by around 300 %…what is the trigger to raise sales? Any idea
Previous yrs to 2024…what changes made by management to get this much big push
To find the answer, please watch the YouTube video below from 47 minutes onwards.
THE GAME OF GUIDANCE AND PREDICTIONS – SAJAL KAPOOR & ADITYA KHEMKA
Both Sajal Kapoor and Aditya Khemka have explained why Natco is undervalued.
I hope you find it useful.
dr.vikas
Yes we r 3 members from Miyapur
Hello senior . I am currently pursuing my master in neuroscience in the UK and i have seen some people here get into healthcare private equity role or healthcare investment banking role. How is the scene in india . I want to get into equity do you think clearing CFA will improve my chances . Thanking you
look interesting .SME sector is the problem.some regulation is goin on in the SME level
(post deleted by author)
Its simple, whenever leverage increases, NIM will decrease, even if yield, cost of funds, spread remains constant.
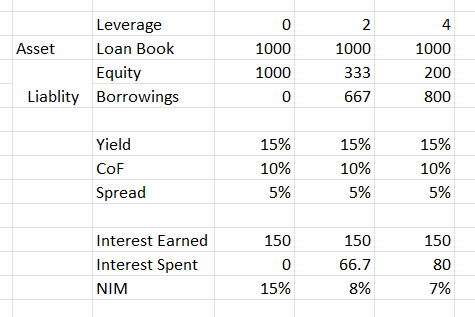
Its because when leverage is low majority of source of fund is equity component for which there is no interest payment, but as and when leverage increase, % of equity component in source of funds decreases and % of borrowed money increases which increase the interest paid which automatically decreases NIM. Same happens in RoA also. Its just mathematics, nothing to do with business ability or inablity, high yield or low yield, high or low cost of borrowing.
Now when a company is raising money at 9% when leverage is 2, then in most case very same company will raise money at few basis point higher, say 9.2%, when leverage is 3. When you add this to above calculation NIM will further contract
Share holders approval was done on 1st of June-2024. secured creditors, debenture holders and unsecured creditors approvals were also done. It looks like merger is not very far.
@valorem: The Long-term trend reversal screener can show sector-wise trends. Currently it shows a downtrend in IT & consumption, and an uptrend in capex related stocks.
I think tops and bottoms are only clear in hindsight, and no method can pinpoint an exact top or bottom. Even the Equity/Bond vs Dividend Yield chart – if you look at the bottoms in early 2000s or in 2009, the Equity/Bond fell far lower than Div Yield.
While the current market looks overvalued on a lot of charts, markets can remain overvalued (or undervalued) for extended periods of time. Also, we are heading towards lower interest rates and if Trump wins in the US then that could spell the end of the Russia war.
TLDR: I have no clue on identifying tops or bottoms but some charts may give a warning sign that you should then check with the real world.