Blockbuster set of results from Anup
Order book – Rs 854 Crores
EBIDTA of Rs 37 Crores, growth of 24%
Margin at 23.7% vs 20.9%
Net Profit of Rs 43 Crore, growth of 121%

Blockbuster set of results from Anup
Order book – Rs 854 Crores
EBIDTA of Rs 37 Crores, growth of 24%
Margin at 23.7% vs 20.9%
Net Profit of Rs 43 Crore, growth of 121%
You should also look at trade payables as some companies might classify them as debt which triggers interest. It’s a common practice.
Paras Defence and Space Technologies Limited has received a contract from Indian Farmers Fertiliser Cooperative Limited for spraying agri-products using drones, covering up to 5 lakh acres, with a value of approximately Rs. 20 crores. The contract is to be executed by September 30, 2024.
786cd120-c2c4-4aff-b0bc-64327d819d8c.pdf (273.0 KB)
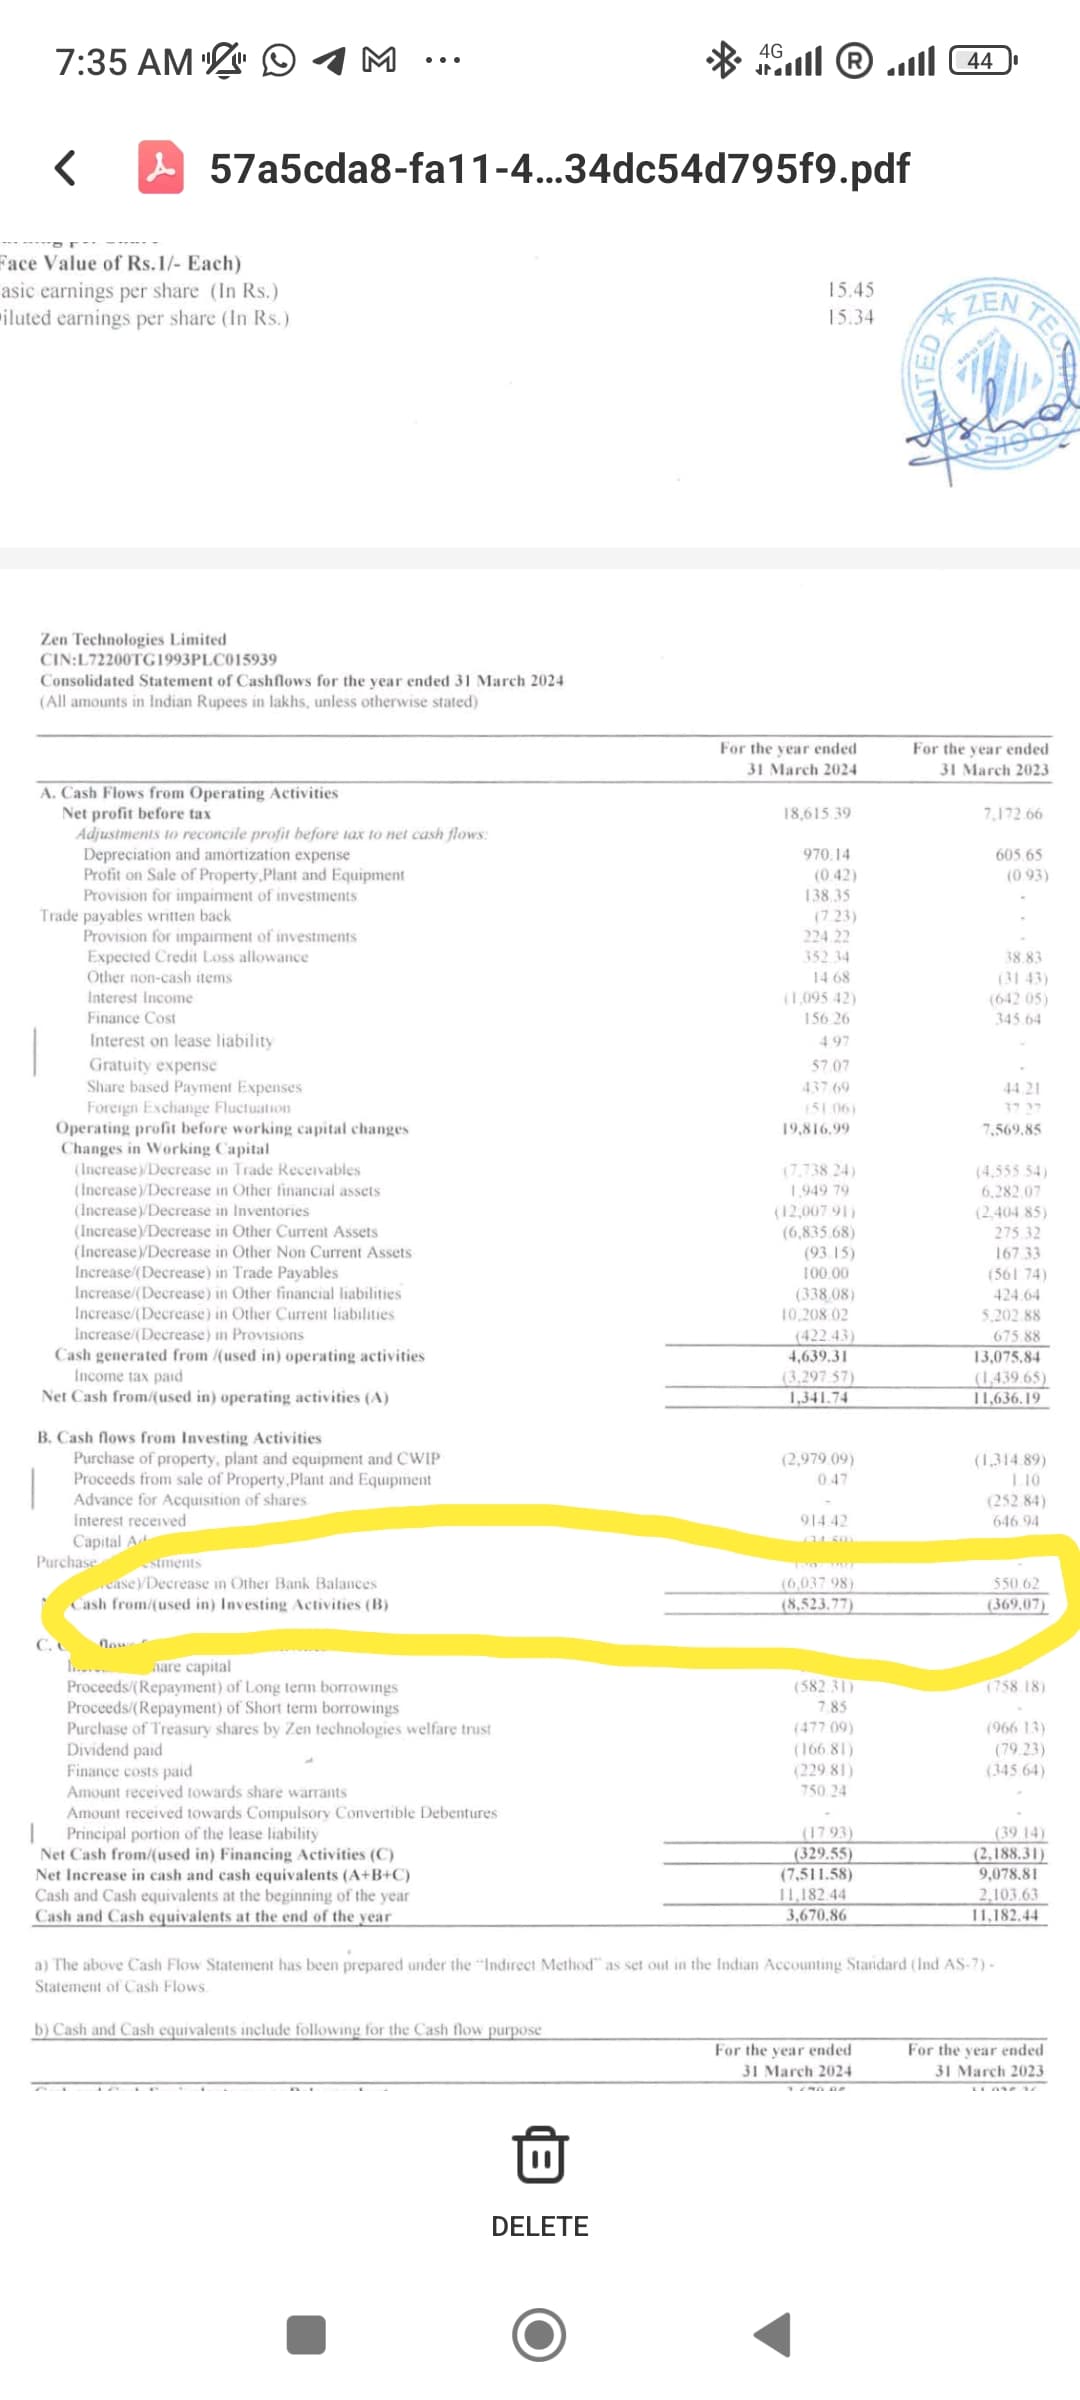
Can some one please explain what is the meaning for the Cash flow entry please, where they have shown ‘Increase or Decrease of Cash Balances’ . I am not a expert at reading Balance sheet
It is needed for future work delivery…
Revenue sequentially was up 3% while expenses have gone up by 7%. Is it because of input cost appreciation or high logistics cost due to red sea disruption?
Little Disappointed with results.
The P&L was on the expected lines, as per the previous concalls.
However the Cash flow from operations seemed very bad, with inventories and receivables being a drag on balance sheet. Need to see explanation from management.
Disc: Invested
The management feels current growth rate of 30% can be maintained (sky is the limit as per mgmt)
Usha Martin –
Q4 FY 24 concall and results highlights –
Revenues – 829 vs 855 cr
EBITDA – 152 vs 154 cr ( margins remained stable at 18 pc )
PAT – 106 vs 105 cr
Segment wise revenues –
Wire Ropes – 607 vs 598 cr ( this is the high value add, high margin segment for the company )
Wire and Strand – 66 vs 79 cr
LRPC – 85 vs 105 cr
Wire Ropes – contributed to 71 pc of sales vs 67 pc YoY – indicating an improvement in quality of business
Export:Domestic sales breakup stood at – 55:45
EBITDA / Ton for Q4 @ Rs 31728. It remained in the 31k -34 k band throughout FY 24
Gross Debt @ 292 vs 347 cr YoY
Net Debt @ 124 vs 191 cr YoY
Wave – 1 capex at Ranchi facility is expected to commence commercial production in Q1 FY 25. New capacities are mainly focussed on company’s value added segments. Meaningful ramp up from this facility is expected in 9-12 months
Wave -2 of Ranchi capex ( company is spending 167 cr for this phase ) is expected to be completed in 18-24 months
Demand scenario remains stable. Order book is also healthy. However – since 85 pc of company sales are in the replacement segments, company is generally not too dependent on new order flows
Brunton Shaw – company’s subsidiary in UK is now sourcing from India and Thailand. This gives them a cost advantage of $300-400 / Ton which is critical. Brunton Shaw also has on order book of 6-8 months at hand
Because of logistical issues due red-sea disruptions, some of company’s sales have been pushed into Q1 – from Q4. Also due to planned maintenance of 06 weeks wrt LRPC making equipment, company lost production in Q4. But for these, Q4 growth would ve been higher
Expecting a 12-15 pc CAGR volume growth in FY 25,26
Rock Knitting wires – used in mountainous terrains is a lucrative opportunity both wrt volumes and margins. Company expects its capacities to make specialised Aluminium, Zinc wires for this segment to go live in FY 25
Saudi Arabia – Mkt demand is buoyant, plus it’s a large mkt. Oil/Gas, Infra, Ports – segments in Saudi Arabia are generating good demand for company’s products. Should start to contribute meaningfully to company’s revenues in FY 25
Synthetic Slings – is another segment that company is planning to launch wef Q2 FY25. To initially supply to UK, European mkts. It finds wide applications in Wind energy , Oil-Gas sectors
Aim to be around 20 pc kind of EBITDA margins in FY 25
LRPC segment is seeing pricing pressure due increased competition. Company is trying to focus more on the plasticated, galvanised LRPCs to protect its margins
Wave – 1 capacity coming on stream is around 40,000 MT/yr. Wave -2 capacities are around 10,000 MT/yr. Company sold around 1,80,000 MT in FY 24
Currently – US contributes to around 5 pc of sales. Targeting – manning ropes, elevator ropes and gondola ropes – as growth areas in the US mkt. Plus these r high margin products
Company is making very good inroads wrt new customer acquisition in EU mkts ( specially in oil/gas – offshore and wind energy segment ) – expecting to receive meaningful orders from new customers in next 2-3 Qtrs
Disc: holding, biased, not SEBI registered, not a buy/sell recommendation