
I believe credit cards is an inherently very sticky business and even foreign banks find it difficult to acquire customers in India as their target audience is mainly tier 1 cities with already good credit scores Is This the End of Credit Card Business in India for Foreign Banks? | TechnoFino – #1 Community Of Credit Card & Banking Experts
Posts in category Value Pickr
SBI Cards & Payment Services Limited (24-09-2023)
Management as guided 1 million new card acquisition this FY and also I am very bullish as I track its monthly spends https://www.technofino.in/community/threads/credit-card-data-june-2023-total-spends-total-active-credit-cards-etc-rbi.15600/ and also its market share, it is gaining market share, also some BNPL are shutting down due to some regulations and also many new age credit cards such as cards with tie up from SBM bank are losing customers due to funding winter, so cost of acquiring customers and excessive rewards shall be mitigated which is really nice, SBI cards cost of funding has also reached its peak and it shall reduce from FY25 onwards if RBI starts lowering rates.
KPI Green- Turning Sunshine Into Cashflows (24-09-2023)
Concall notes, Q4 FY23
Project Milestones
- Commissioning of First Hybrid IPP Project (16.1 MW wind + 10 MW solar) in March ’23
- Cumulative Energized Capacity: 137+ MW (up to March ’23)
- Cumulative Capacity under CPP: 175+ MW
- Total Capacity: 312+ MW
Historic Achievement
- Commissioning of Seventh Turbine under Hybrid Policy in South Gujarat
- Opening New Markets for Wind Energy in South Gujarat
Financial Highlights
- YoY Revenue Growth: 179%, INR 231.51 crores to INR 647.03 crores
- Quarterly Revenue Growth: INR 179.66 crores to INR 184.41 crores (Q3 FY22-23)
- YoY EBITDA Growth: 91%, INR 110.35 crores to INR 211.25 crores
- EBITDA Margin Change: 47.6% to 32.65%
- YoY PBT Growth: 139%, INR 59.76 crores to INR 141.87 crores
- YoY PAT Growth: INR 43.25 crores to INR 109.63 crores
Segment Analysis
- IPP Segment: Energized 36+ MW, cumulative capacity of 137 MW
- 26.1 MW hybrid IPP project capitalized in Q4 ’22-’23, revenue accrual in FY23-24
- CPP Segment: Energized 111 MW, cumulative capacity of 175+ MW
- IPP Orders: 42 MW, CPP Orders (including hybrid): 74 MW
Sales Growth
- Consolidated Sales of Captive Projects: 225% growth, INR 168.39 crores to INR 549.97 crores
- IPP Segment Sales: 64% growth, INR 57.59 crores to INR 94.73 crores
- Revenue Mix Shift: CPP vs. IPP changed from 75:25 to 85:15, impacting overall margin
Operational Cash Flows
- Net Cash from Operating Activities: 56% increase, INR 102.38 crores to INR 159.38 crores
CAPEX
- Total CAPEX during FY22-23: INR 266.27 crores
- Funding Mix: Debt (INR 159.75 crores) and Internal Accruals (INR 106 crores)
- Debt-Equity Balance: Maintained at approximately 2:1
Average Realization for CPP Projects per MW
- Average Realization: Approximately 4.25 to 4.50 crores per MW
Average Cost of IPP Projects per MW
- Average Cost Factors: Size of the project, transmission voltage (11 kV or 66 kV), and infrastructure
- Cost Range: Approximately 3.75 to 4.10 crores per MW
Average Cost of Land
- Current Land Capitalization: Approximately 82.80 crores on the consolidated books
- Plant valuation is around 700 crores
- Ownership: Majority of the land is owned, with a total land bank of 1,347 crores, out of which 700 crores is owned land.
FY24 Targets for IPP and CPP
- Minimum Growth Target: 50% to 60% in both IPP and CPP segments
- No Ceiling: Opportunity to exceed targets if better deals are secured
- Aiming to Add 25 to 50 MW this year in both segments
- Long-term Goal: Achieving 1 GW (1,000 MW) by 2025
Expectations for CPP Orders
- Current CPP Order Book: 109 MW (approx. 430 crores)
- Additional Orders in Pipeline: Expected to be finalized in the coming months
Long-Term Annuity Income
- Annuity Income for CPP: Rs. 10 lakhs per MW, totaling Rs. 100 crores for 1,000 MW
- Revenue for IPP: Anticipated revenue increase from Rs. 100 crores to Rs. 250 crores
- Average Annual Annuity Earning for IPP: Rs. 75 crores
- EBITDA Expected to be 74% of the annual annuity income
IPP Policy:
- Validity: The IPP policy is currently in effect and will remain so until December 31, 2025.
- Policy Type: Under this policy, the company operates its IPP projects following an open access policy. Open access allows power producers to supply electricity directly to consumers or through the grid, ensuring fair and non-discriminatory access to transmission and distribution systems.
Hybrid Policy:
- Expiry Date: The existing hybrid policy, which allows the company to generate power from multiple sources like wind and solar, is set to expire on June 18 of the current year.
- Expectation: The company anticipates that a new hybrid policy with extended benefits will be introduced after the current one expires.
Advantages of the Hybrid Policy:
- Under the hybrid policy, the company enjoys several benefits:
- Monthly Power Banking: This allows them to save power for future use, enhancing operational flexibility.
- Selective Transmission Cost: Transmission costs are incurred only for the leading power source. For example, if wind power takes the lead, transmission costs are applied only to wind-generated electricity.
- Higher Plant Load Factor (PLF): Wind projects tend to have a higher PLF compared to solar projects, contributing to better financial performance.
Revenue Mix Between CPP and IPP:
- The current revenue mix between CPP and IPP is 85% CPP and 15% IPP.
- The company’s revenue mix strategy takes various factors into account:
- Capital Intensity: IPP projects require significant capital investment.
- Leverage Ratio Maintenance: The company needs to maintain a healthy leverage ratio to preserve its credit ratings.
- Tax Planning: Tax considerations play a role in determining the revenue mix.
- Free Cash Flows: Adequate free cash flows are essential for decision-making.
- The company expects the revenue mix to remain similar in the near term, but adjustments may be made based on factors like cash flow generation.
Differentiation Between Solar, Wind, and Hybrid Projects:
Performance (PLF):
- Solar PLF (Plant Load Factor): Approximately 26-36%.
- Wind PLF: Around 36%.
- Hybrid PLF: Combined solar and wind, approximately 48% (weighted average).
CAPEX (Capital Expenditure):
- Solar CAPEX is relatively lower.
- Wind CAPEX is higher due to higher generation potential.
Payback Period:
- Solar Payback: Typically shorter, around 5-7 years.
- Wind Payback: Longer, around 15-18 years.
- Hybrid Payback: Estimated to be around 5-7 years.
Average Cost of Debt:
- Rate: The average cost of debt on the company’s books is approximately 9%.
Loan Tenure:
- Duration: The tenure for the company’s term loans, including capital-intensive loans, typically ranges from 10 to 13 years. This means the company plans to pay back these loans over this period.
Unique Selling Proposition (USP) and Key Differentiators:
- Profitability: The company stands out in the renewable energy sector by consistently generating good profits while many other unlisted renewable companies are facing losses.
- Margins: The company maintains healthy profit margins, differentiating itself from peers in both the IPP (Independent Power Producer) and CPP (Captive Power Producer) spaces.
- Transparency and Legal Compliance: A key USP is the company’s commitment to transparency and adherence to legal and regulatory standards. The company emphasizes conducting its business in a clear and legally compliant manner.
- Business Diversification: The company’s unique approach involves operating in both IPP and CPP segments, making it distinct from its peers. This dual business model contributes to its profitability.
- Efficiency and Speed: The company prides itself on its ability to complete projects swiftly, often in three to six months, compared to industry averages of 18 months. This efficiency contributes to higher customer confidence and order flow.
- Pipeline Preparation: The company’s forward-looking strategy involves preparing its project pipeline several years in advance, ensuring a steady flow of projects and orders.
- Customer Trust: The company’s strong reputation and track record have earned the trust of its customers, leading to consistent order placement and business growth.
Project Size Flexibility: The company can handle projects ranging from 1 MW to 30-40 MW on the CPP side, offering flexibility in project sizes.
Funding Working Capital: Working capital for CPP projects is partially covered by clients’ advanced payments, supplemented by the company’s capital for inventory stocking.
O&M Costs: The annual O&M cost per megawatt is approximately 2 lakhs.
Revenue from O&M (CPP): Clients are charged 5 lakhs per MW annually for O&M services, contributing to revenue.
Mitigating Performance Risks: The company assures an 85% generation guarantee for CPP projects, minimizing performance risks. Some projects have warranties until 2030, further reducing risks.
RFP Certificates Realization:
In 2022-23, the company realized approximately Rs. 25-30 lakhs from RFP certificates. These certificates mainly pertain to 7 kW projects that are in the registration process.
Loan Assistance for IPP:
As of March 31st, the loan assistance for IPP stands at 409 crores.
Stock Panel Management:
The company maintains stock panels for various purposes. While they do not generate revenue from their own CPP and CAPEX, they aim to take advantage of price fluctuations and market conditions.
Impact on Margins:
Maintaining lower stock levels aligns with the goal of securing favorable margins and obtaining discount rates.
Order Book Status:
As of 2022 year-end, the order book exceeded 100 MW, and currently, in 2023, it stands at 116 MW. While the difference is slightly lower than anticipated, the company has a substantial order pipeline for IPP, which they cautiously consider based on immediate CAPEX plans.
CPP Volume and IPP Margins:
The company focuses on CPP projects for volume growth, while IPP projects contribute to higher margins and profitability.
Competition within Group Company (IPP Segment):
KPI Energy’s entry into the IPP segment won’t create competition within the group as they target different customer segments.
Expansion Beyond Gujarat:
The company plans to expand to other states, including Telangana, Rajasthan, MP, Maharashtra, and Karnataka.
Business Dealings with Tristar Transport:
The company collaborates with Tristar Transport on green hydrogen projects, leveraging Tristar’s expertise in hydrogen logistics in the UAE.
Difference in Margins (CPP vs. IPP):
- CPP (Captive Power Producer): Lower EBITDA margins (approx. 30-35%) due to competition, changing rates, and shorter-term contracts.
- IPP (Independent Power Producer): Higher EBITDA margins (approx. 70-75%) as it’s a CAPEX-based business selling energy, offering stable and long-term returns.
Debt Status:
- Debt-to-Equity Ratio: Currently at 2:1, considered healthy for a capital-intensive industry.
- Debt Management: Plans to maintain a similar ratio in the future.
Expansion Plans:
- Scaling Up: Exploring opportunities to become a larger player, aiming for projects with sizes like 250 MW in government tenders.
- Dedicated Team: A separate team is actively pursuing such opportunities.
SBI Cards & Payment Services Limited (24-09-2023)
in their recent concall their credit cost increased to 6.8% more than management expected and it was mostly from the cards sourced in 2019, they have guided for credit cost in the range of 5.8-6.2%, also have reduced credit limits which is very rarely done by any bank’s card. I find that as a positive and also I personally hold 2 SBI Credit cards their app is one of the best and is customer centric, it is the only company that allows a credit balance refund to be credited in the bank through the app itself, I also have used their credit on UPI feature which I feel is a gamechanger as people generally use UPI for everything and credit cards are mostly used for big ticket purchases it is very convenient.
Jupiter Wagons Ltd (previously CEBBCO) (24-09-2023)
I worked on some hypothesis and exited my position @407 (entry price was around 200 just before Q1 results). My thought for exit was as below:
Company posted an excellent set of Q1 numbers. This along with Railway’s Mega theme, stock was continuously one way ride from 200 to 400+. QIP plans were in works and it was expected that soon company may announce the same post board approval.
- Company’s last QIP was raised at around Rs 120 and it’s 52 week’s low is around Rs 70-80. Any incoming investor would expect for decent upside and hence at peak price Rs 400+ it was significantly higher than QIP raised 4 months back.
- Nearest competitor Texmaco rail has market cap of Rs 4000 Cr (against JWL’s peak valuation of Rs 15000 Cr). Texrail has also announced the QIP of Rs 1000 Cr which would be ~20-25% stake dilution for incoming investor compared to 5% stake in JWL at peak price. So, from investor’s point of view, Rs 400+ may appear stretched price.
- While JWL has many pluses compared to texrail including significantly better margins, diversified future revenue streams, good steps in terms of technology tie up for making brakes, wheels etc along with getting into last mile connectivity through commercial EV etc, however, texrail is also working on efficiency, tie ups with European companies, tie up with Hindalco and on top of it is part of Birla Group.
For any upcoming investor, there would be comparison between the two wherein they would weigh their options to make a deal. Basis inputs from last concall of JWL and all above factors I felt that post QIP announcement price may correct to pave the way for investor to come in at a price wherein it becomes attractive to them (JWL’s float is low i.e; around 8% due to which price movement is always expected to be sharp).
Basis my estimation, I worked out a price of ~Rs 275-280 and hence exited on subsequent day of QIP announcement. Exit was also as I got almost 100% returns (for my initial tranche’) in ~1.5 month.
Now, I think even to get this estimated price, stock has to come down to this level and then stay for sometime to meet the criterion of SEBI (QIP price can not be lower than average price of last 2 weeks). Even as on date, average price for 2 weeks is around Rs 350/- which to me looks high from investor’s point of view. I will closely monitor the price in upcoming week and decide re-entry.
I could be wrong for this hypothesis though this worked for me. Thanks.
INOX Wind (24-09-2023)
Wind power Capacity added during 23/24
( From april to july ): 1306 MW
last year addition: 2276 MW
So, Already 60% Capacity of last year added in 4 months of this FY.
Growth in the sector is clearly visible
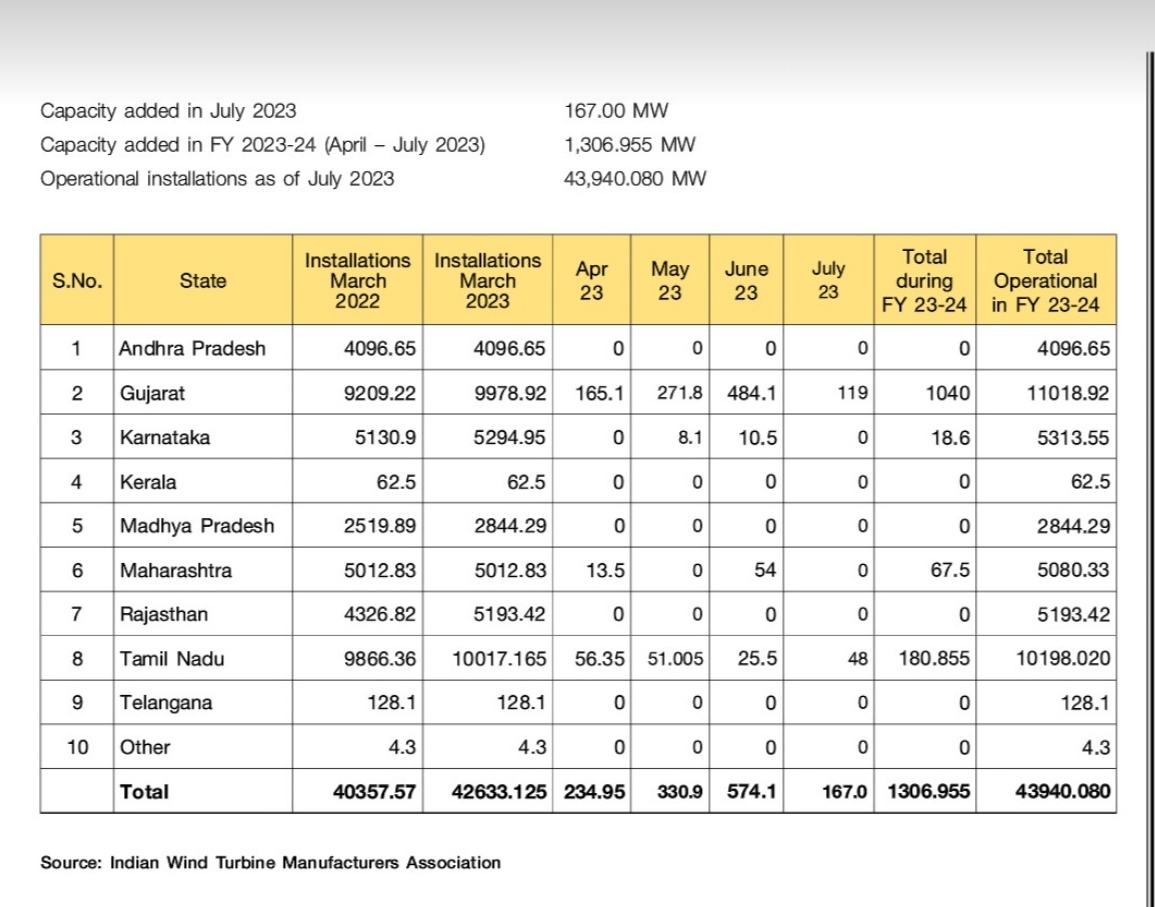
Source: Windpro / Indian wind turbine manufacturer association.
Narayan Portfolio (24-09-2023)
Sir, if in any companies nonexcutive directors are not hold any stake in that company. It is described good or bad things about company?
EKI Energy is that a story or fact? (24-09-2023)
Not sure why mainstream media has not reported declaration of result of eki energy
About the Q&A: Questions & Answers category (24-09-2023)
In any company non executive directors have no stake(share) in that company. It is good thing or bad thing about company? Pls answer in brief.
About the Investing Strategies category (24-09-2023)
1, Don’t follow hot stock it’s may burning ur hands!
2,Avoid A listed company of GOVERNMENT (because end of the day it’s not their hard earned money).
3, if u believe in ur gaining business stock then average it(don’t average ur losses stock if u can’t understand that business).
4, Don’t invest sevice related company it’s always like IT and Distribution.
5,Read how much u can and read first bad business and then Good one so u can understand that.
6, don’t run for promoter holding it’s doesn’t matter if business is good.(example Elon Musk have only 5% in Tesla so it’s doesn’t matter end of the day)
7, Follow business first then fundamental and balance sheet.
8, other stock do well when ur not don’t panic if ur business are good.
9, Follow the experience investor but don’t copy then only listen and apply their statistics.
10,B2B business can’t grow up exponential.