Total number of stores now 125. Sahibganj (Jharkhand).
In this FY their number of store grew by ~20%. Form last year to date store count grew by ~40%. Aggressive growth.
CRISIL rating upgrade to A-/ stable from BBB+/ stable.

Total number of stores now 125. Sahibganj (Jharkhand).
In this FY their number of store grew by ~20%. Form last year to date store count grew by ~40%. Aggressive growth.
CRISIL rating upgrade to A-/ stable from BBB+/ stable.
Great research!
Couple of questions:
If the lease expired 5 years ago, how are they still using it. I mean 5 years is a long time. Are they still paying any lease rent?
250 Crores is a big amount, any details of calculations you have done? Is it possible some of it went into IPO expenses/ debt repayment, etc?
Is it really a bad think to have revenue based bonuses? Think it if often a pretty common norm.
Disclosure: Have a small tracking position.
Hi Aditya,
I have been researching this stock for a while now.
Below are few risks apart from the ones you pointed out.
The company had a single location in Rann of kutch and the lease agreement with the government ended in 2018 and it never got renewed till date. They didn’t mention this in the IPO document but auditor flagged it in latest annual report
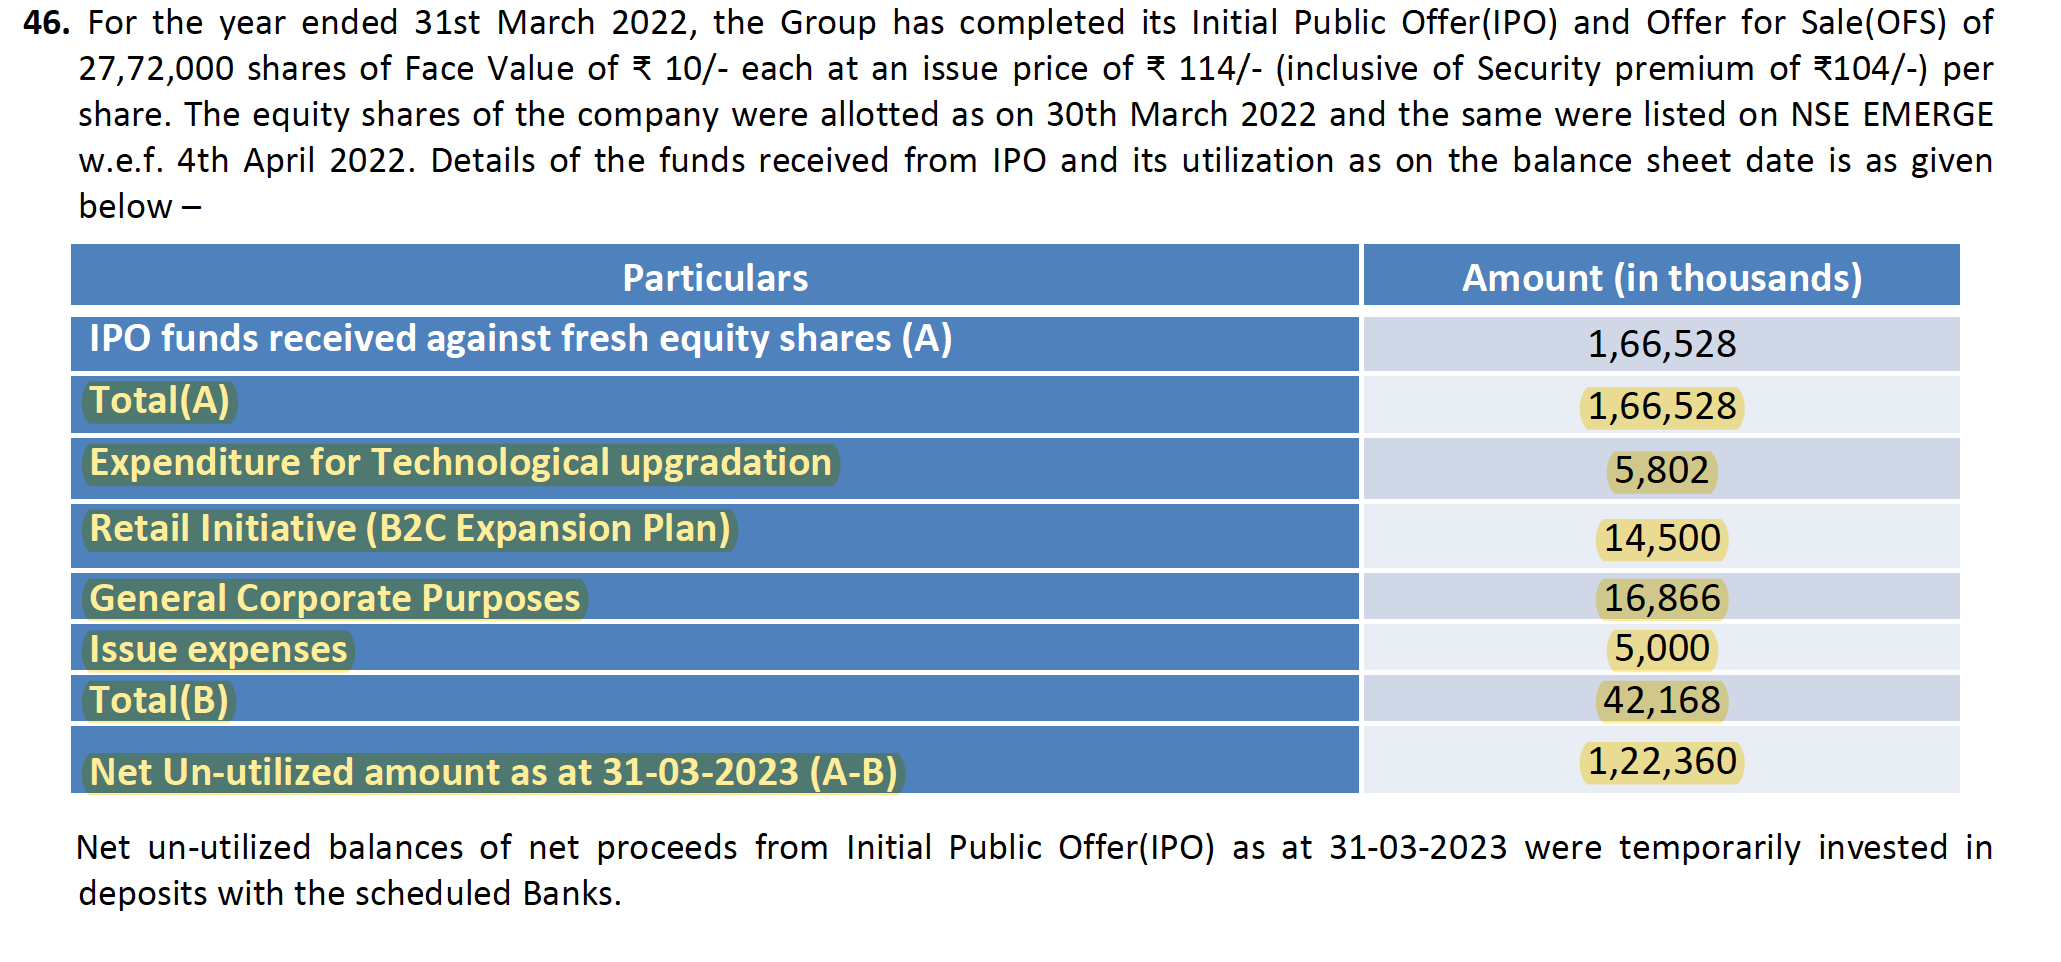
IPO proceeds, i have this bad habit of chasing after money, when loads of it falls into balance sheet.
If you do a basic triangulation of IPO proceeds and profits earned using cash flow statement and balance sheet, you will see 250 crores missing.
If you read the last 2 concalls there is a book keeping question asked by an analyst which is at the end of the concall transcript.
Q: why did your employee costs suddenly increase?
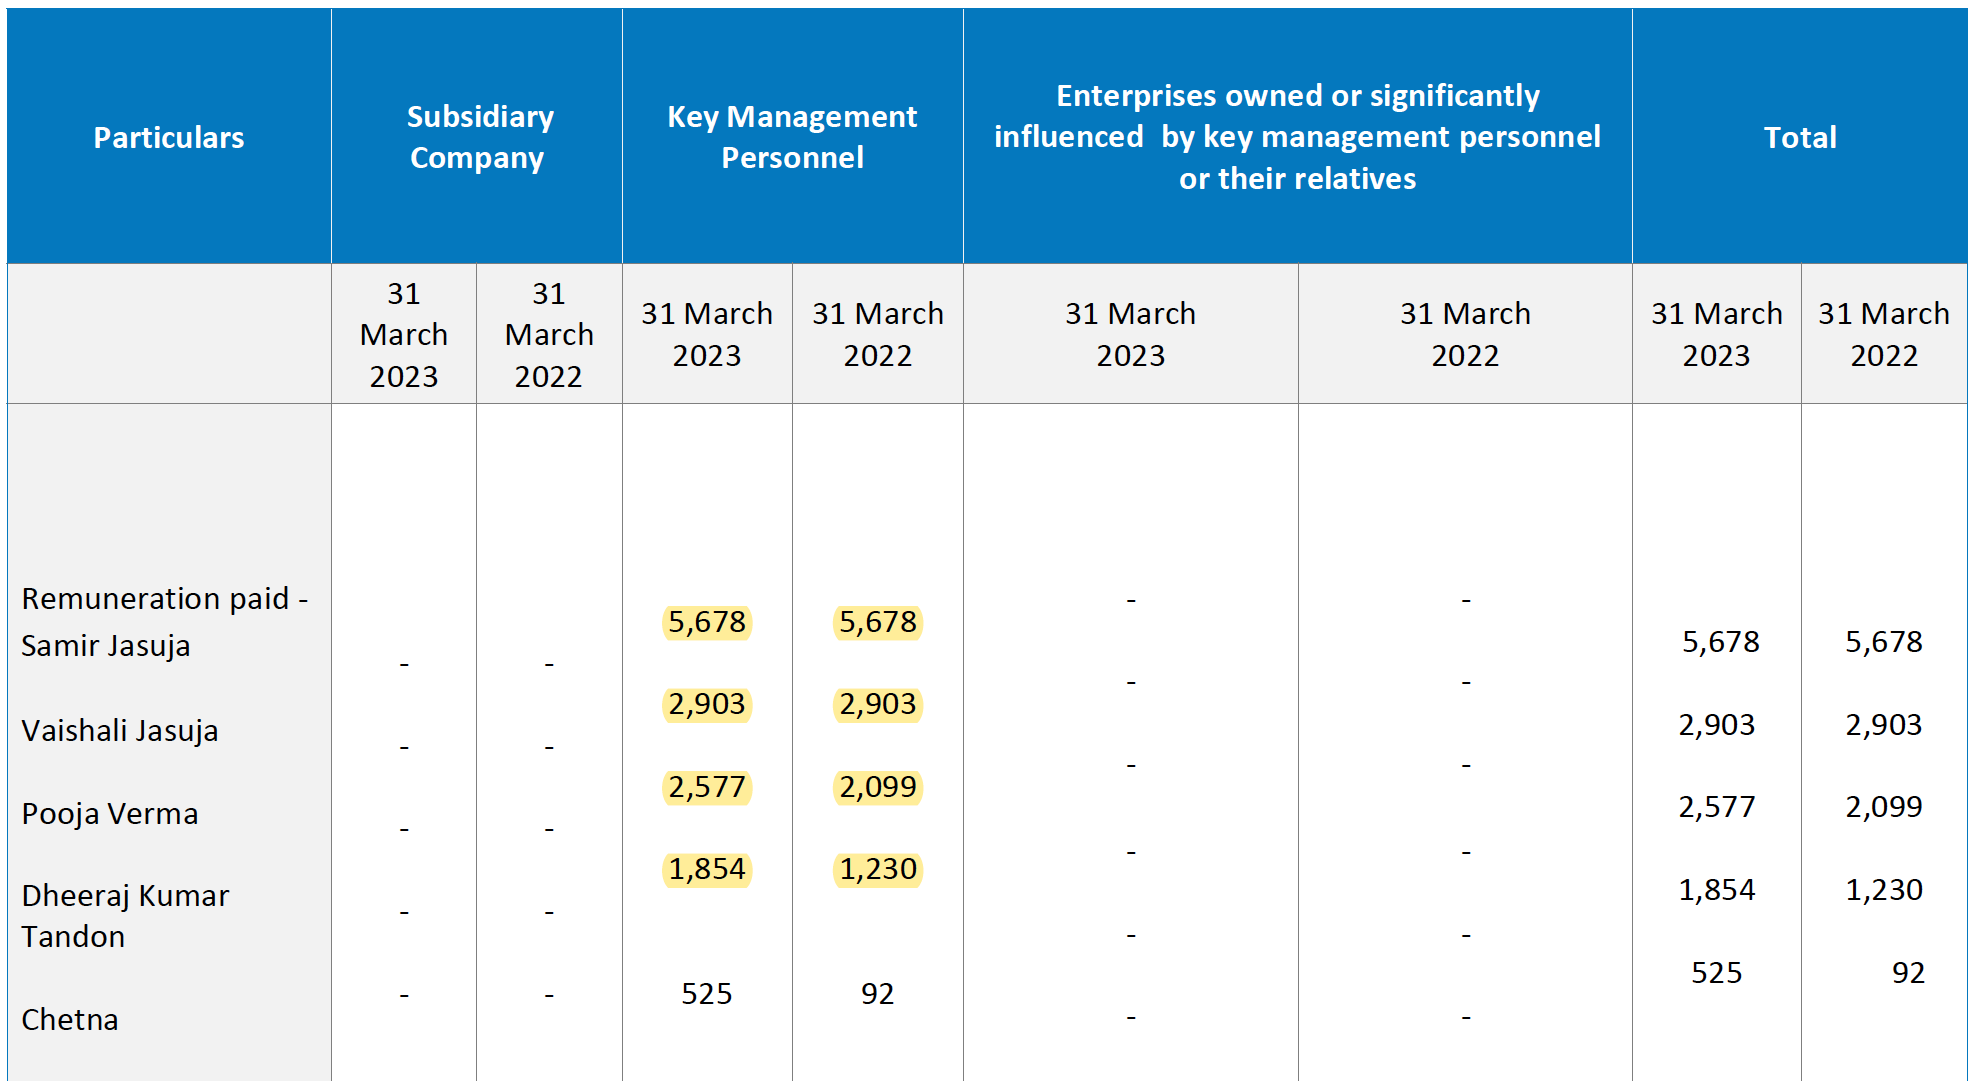
The finance folk from company said, the promoter takes 2-3% of revenue as commission. This information not mentioned in agm or ipo document anywhere.
These are key risks i identified.
I could be wrong do your own due diligence
Dodla Dairy Q1 FY 24 concall highlights –
Revenues-823 vs 717 cr
Gross Profit-195 vs 166 cr (@ 23.7 vs 23.3 pc)
EBITDA-60 vs 45 cr ( @ 7.3 vs 6.3 pc )
PAT-35 vs 25 cr ( @ 4.2 vs 3.5 pc)
Sale of value added products (VAP) @ 258 cr, up 13 pc YoY. VAP sales now at 32 pc of total
LY, sales from VAP was 27 pc. VAP sales peak in Q1
Industry benefiting from upcoming flush season. Likely to peak in Sep-Oct
Avg milk production in Q1-15.9 lakh Lit/day, up 7.5 pc
Avg milk sales in Q1-11.1 lakh Lit/day, up 6.2 pc
Avg curd sales in Q1-439 Tons/day, up 3.1 pc
Current number of Dodla retail parlours – 596
87 pc of milk directly produced from farmers
Company has – 123 chilling centers, 15 processing plants, 01 Feed plant ( through its subsidiary – Orgafeed )
Company has global presence in – Uganda, Kenya
Company sells in 13 states in India
There were price cuts of 4-5 pc blended for cow + buffalo milk in Q1. However, company refrained from procuring at lowest possible prices so as to not hurt farmers and for better long term sustainability of the business – a great step – IMHO
Due to upcoming flush season, GMs may go up a little more in Q2
Company’s working capital cycle is extremely healthy vs peers. Company maintains strict discipline here, even at the cost of compromising on some additional business
Company is able to hold onto Mkt share in Karnataka despite aggression from Nandini. Dodla pays same to farmer as Nandini (despite govt giving subsidies to farmer to sell to Nandini) but sells at slightly higher price due better product Quality and better internal efficiencies
Avg procurement/realisation prices for milk for Q1 at – Rs 39.6/Rs 55.6
In Africa, Q1 revenues were 60 cr and EBITDA was 14 pc (very high margins here)
Orgafeed capacity expanded, to go live in August
Srikrishna Milks (subsidiary)-did EBITDA of 5 cr @ 8.7 pc margins in Q1
Aim to increase share of VAP by 1-1.5 pc / yr
VAP sales breakup for Q1 –
Curd- 187 cr
Ghee Butter- 9 cr
Ice cream- 13 cr
Paneer+Sweets- 14 cr
Lassi- 6 cr
Buttermilk- 10 cr
Confident of maintaining Q1 levels of EBITDA margins in FY 24. May improve a little due flush season
Aim to grow the revenue by 15 pc in FY 24
Differential between avg selling price/ lit between Nandini vs Dodla is Rs 8-9 in Dodla’s favour !!!
Current Cash balance at – 467 cr at consolidated level
India capacity utilisation at 65-66 pc currently
Disc : holding
Hi. NWML shares have not come to demat but in my NSDL statement, I’m able to see full alloted qty without price quote.
Volumes play an important role in chart analysis. I usually look at volumes mainly in few scenarios.
First is during some kind of volatility contraction pattern, where stock price undergoes tight consolidation/compression and volumes dry up totally. If there is a breakout from this kind of a pattern, it should ideally be with very heavy volumes. ( Its very rare to see such a breakout with lower than expected volumes. )
Second is during initial stage of correction in a particular stock. When after a sustained bull run, we get a big bearish candle with very heavy volumes, it is usually a precursor to a bigger fall. Most of the times during routine bull market corrections, the corretions happen on low volumes as compared to volumes on up days.
Thirdly when there is a major breakout above a strong resistance area, say breakout from a cup and handle, or inverted head and shoulders or a rounding bottom, or above 52 weeks highs, or multiyear highs, a big bull candle on weekly charts with heavy volumes gives added confirmation.
Most of the technical analysis books will lay emphasis upon volumes along with price action. I usually don’t put up volumes in most charts I put up because it creates too much messiness in the picture. But usually I check volumes to confirm that they are in sync with pattern breakouts.
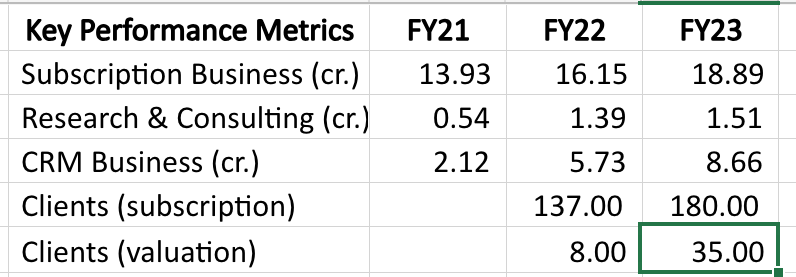
Propequity has been doing very well business wise, growing both their subscription and valuation vertical very well. Breakup between them can be seen below (CRM is their valuation business).
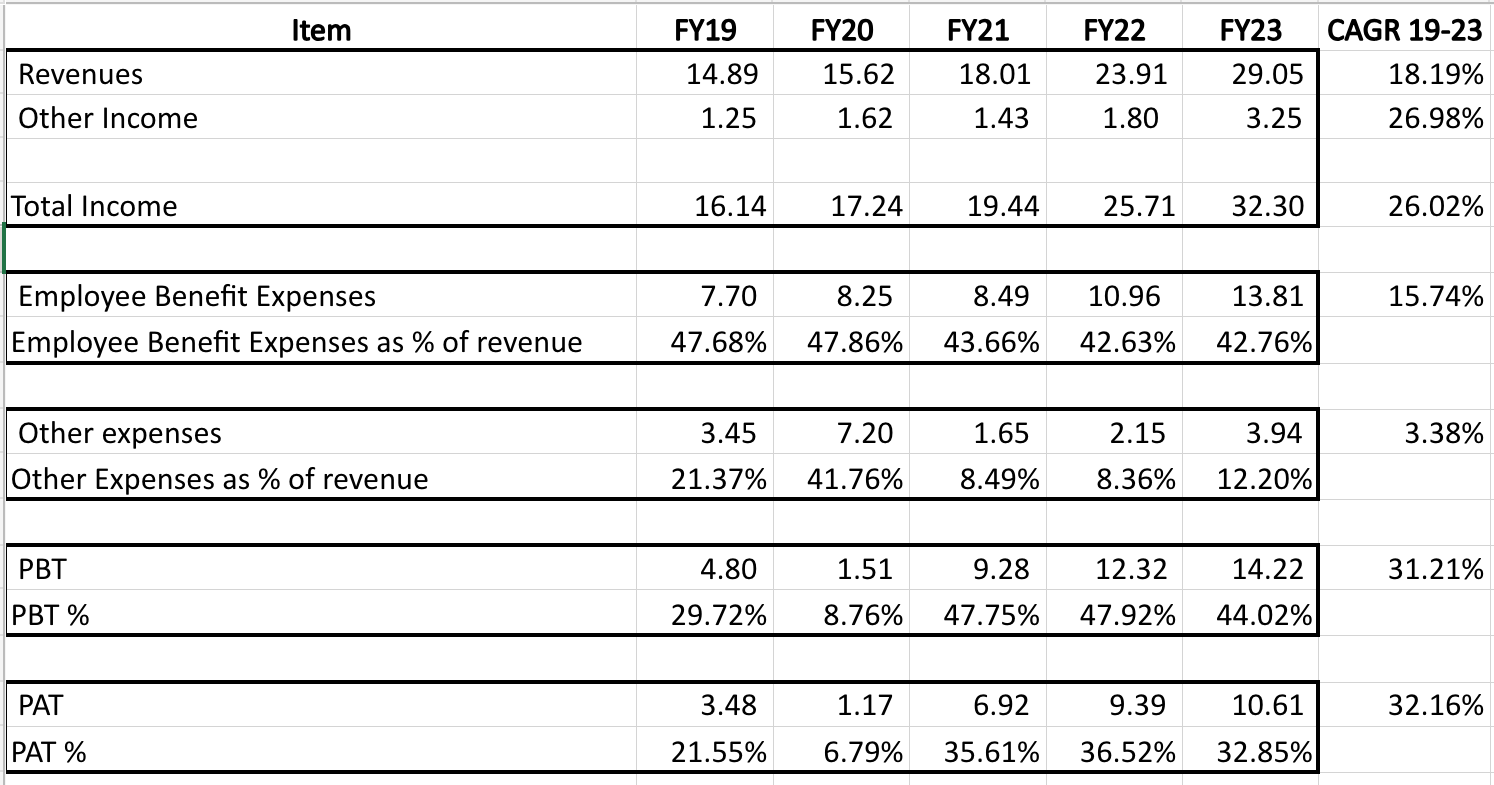
Longer term financials are below.
I am sharing notes from their recent annual report.
Financials
General points
Propedge:
IPO utilization
Related party transactions
Disclosure: Invested (position size here, no transactions in last-30 days)