
please include me too
Posts in category Value Pickr
Apar Industries (24-08-2023)
| Yearly | ||||
|---|---|---|---|---|
| Particulars | FY23 | FY22 | FY21 | FY20 |
| Revenue | 14352 | 9317 | 6388 | 7425 |
| Exports | 49% | 38% | 41% | 34% |
| EBITDA | 1269 | 578 | 440 | 495 |
| Margin | 9% | 6% | 7% | 7% |
| PAT | 638 | 257 | 160 | 135 |
| Conductor | ||||
| Revenue | 7013 | 4200 | 2908 | 3600 |
| Volume | 160,131 | 107357 | 128460 | 158104 |
| EBITDA | 716 | 195 | 102 | 183.6 |
| EBITDA per metric tonne | 44114 | 17095 | 7926 | 10790 |
| EBITDA margin | 10.10% | 4.40% | 3.53% | 5.10% |
| Order Book | 5152 | 5409 | 1649 | 2617 |
| Export% | 60% | 38% | 52% | 40% |
| Premium products | 40% | 49% | 33% | 18% |
| PAT | 370 | |||
| Oil Business | ||||
| Revenues | 4656 | 3544 | 2364 | 2311 |
| Exports | 45% | 44% | 41% | 37% |
| Volume growth | 5% | 16% | -1.10% | -6% |
| Volume | 486582 | 461589 | 399214 | 403626 |
| EBITDA | 233 | 292 | ||
| EBITDA margin | 5% | 8.20% | ||
| EBITDA per KL | 4781 | 6347 | 7032 | 2990 |
| PAT | 85 | |||
| Cable Division | ||||
| Revenues | 3263 | 1944 | 1270 | 1600 |
| Exports | 52% | 20% | 17.20% | |
| EBITDA | 348 | 106 | 60 | 178 |
| EBITDA margin | 10.20% | 5.30% | 4.71% | 11.10% |
| Order Book | 1200 | |||
| PAT | 178 |
| Quarterly | ||||||||
|---|---|---|---|---|---|---|---|---|
| Particulars | Q1FY24 | Q4FY24 | Q3FY23 | Q2FY23 | Q1FY23 | Q4FY22 | Q3FY22 | Q2FY22 |
| Revenue | 3773 | 4089 | 3942 | 3235 | 3093 | 3012 | 2229 | 2269 |
| Exports | 53% | 53% | 49% | 47% | 42% | 40% | 35% | 36% |
| EBITDA | 346 | 424 | 347 | 226 | 237 | 174 | 117 | 128 |
| Margin | 9.00% | 10.00% | 9% | 7% | 8.00% | 6% | 5% | 6% |
| PAT | 197 | 243 | 170 | 103 | 122 | 83 | 55 | 57 |
| Conductor Business | ||||||||
| Revenues | 1775 | 2121 | 1908 | 1439 | 1548 | 1503 | 940 | 1081 |
| Volume | 45565 | 49489 | 44538 | 30227 | 35877 | 33849 | 22415 | 29191 |
| Volume growth (YoY) | 27% | 46% | 99% | 4% | 64% | 9% | -29% | -14% |
| Premium product basket | 746 | 976 | 839.52 | 633.16 | 19% | 25% | 19% | 14% |
| Exports | 57% | 58% | 54% | 46% | 41.80% | 44.30% | 29% | 32% |
| EBITDA | 177 | 287 | 222 | 118 | 85 | 60 | 43 | 50 |
| Margin | 9.90% | 13.50% | 11.60% | 8.20% | 5.10% | 4.00% | 4.50% | 4.70% |
| EBITDA per tonne (forex adjusted) | 38740 | 58000 | 49942 | 39108 | 21933 | 17599 | 18987 | 17199 |
| PAT | 101 | 170 | ||||||
| Order Book | 5356 | 5124 | 4885 | 4065 | 3647 | 5409 | 4314 | 2428 |
| Capital Employed | 1111 | 1058 | 1092 | 688 | 690 | 720 | 294 | 510 |
| Oil Divison | ||||||||
| Revenues | 1198 | 1179 | 1241 | 1176 | 1068 | 921 | 905 | 895 |
| Volume (in KL) | 130654 | 131132 | 126731 | 113360 | 115359 | 117021 | 116109 | 113981 |
| Volume growth | 13% | 12% | 9% | -0.50% | 0.80% | 13% | 0 | 0 |
| Exports | 50% | 45% | 43% | 47% | 44% | 42% | 46% | |
| EBITDA | 78 | 48 | 21 | 52 | 112 | 70 | 78 | 60 |
| EBITDA margin(post forex) | 6.50% | 4.10% | 1.70% | 4.40% | 10.50% | 7.60% | 8.60% | 6.70% |
| EBITDA per KL (forex adjusted | 6035 | 3679 | 1646 | 4550 | 9713 | 5979 | 6743 | 5285 |
| PAT | 34 | 7 | ||||||
| Capital Employed | 792 | 750 | 566 | 694 | 798 | 751 | 654 | 649 |
| Lubricants | ||||||||
| Revenues | 241 | 231 | 238 | 207 | 217 | 211 | 199 | 211 |
| Volume (in KL) | 17500 | 18370 | 17063 | 16595 | 17618 | 17098 | 15390 | 16822 |
| Transformer Oil | 40% market share | |||||||
| Cable Business | ||||||||
| Revenues | 967 | 943 | 921 | 762 | 638 | 683 | 486 | 425 |
| Exports | 52% | 52% | 49% | 50% | 43% | 27.30% | 35% | 29% |
| EBITDA | 110 | 117 | 109 | 70 | 49 | 48 | 15 | 17 |
| EBITDA margin(post forex) | 11.40% | 12.40% | 11.80% | 9.20% | 7.60% | 7% | 3.10% | 4.10% |
| PAT | 60 | 148 | ||||||
| Order book | 930 | 1221 | ||||||
| 25-28% is US | ||||||||
| Capital Employed | 596 | 611 | 702 | 688 | 487 | 581 | 520 | 540 |
I was doing some number crunching on Apar. Hope this helps.
Disclosure: Studying. Not invested
Kovai Medical Center and Hospital – Health and Wealth (24-08-2023)
Promoter group bought 16000 shares yesterday.
This is second time promoters are buying the shares in the span of 2 months.
MM Forgings- May shape the portfolio in the right way (24-08-2023)
MM Forgings is targeting 1700 cr topline (FY23 revenue – 1443 Cr) with 18% margins in FY24. Focus on EV market from FY25.
https://twitter.com/Alazyinvestor13/status/1694656452206407799?s=20
E2E Networks Ltd – Listed small Cloud computing player (24-08-2023)
As already mentioned by some members in the thread the main competitors are cloud providers like Digital Ocean, Vultur and Linode who provide cloud solutions similar to E2E Networks with comparable pricing.
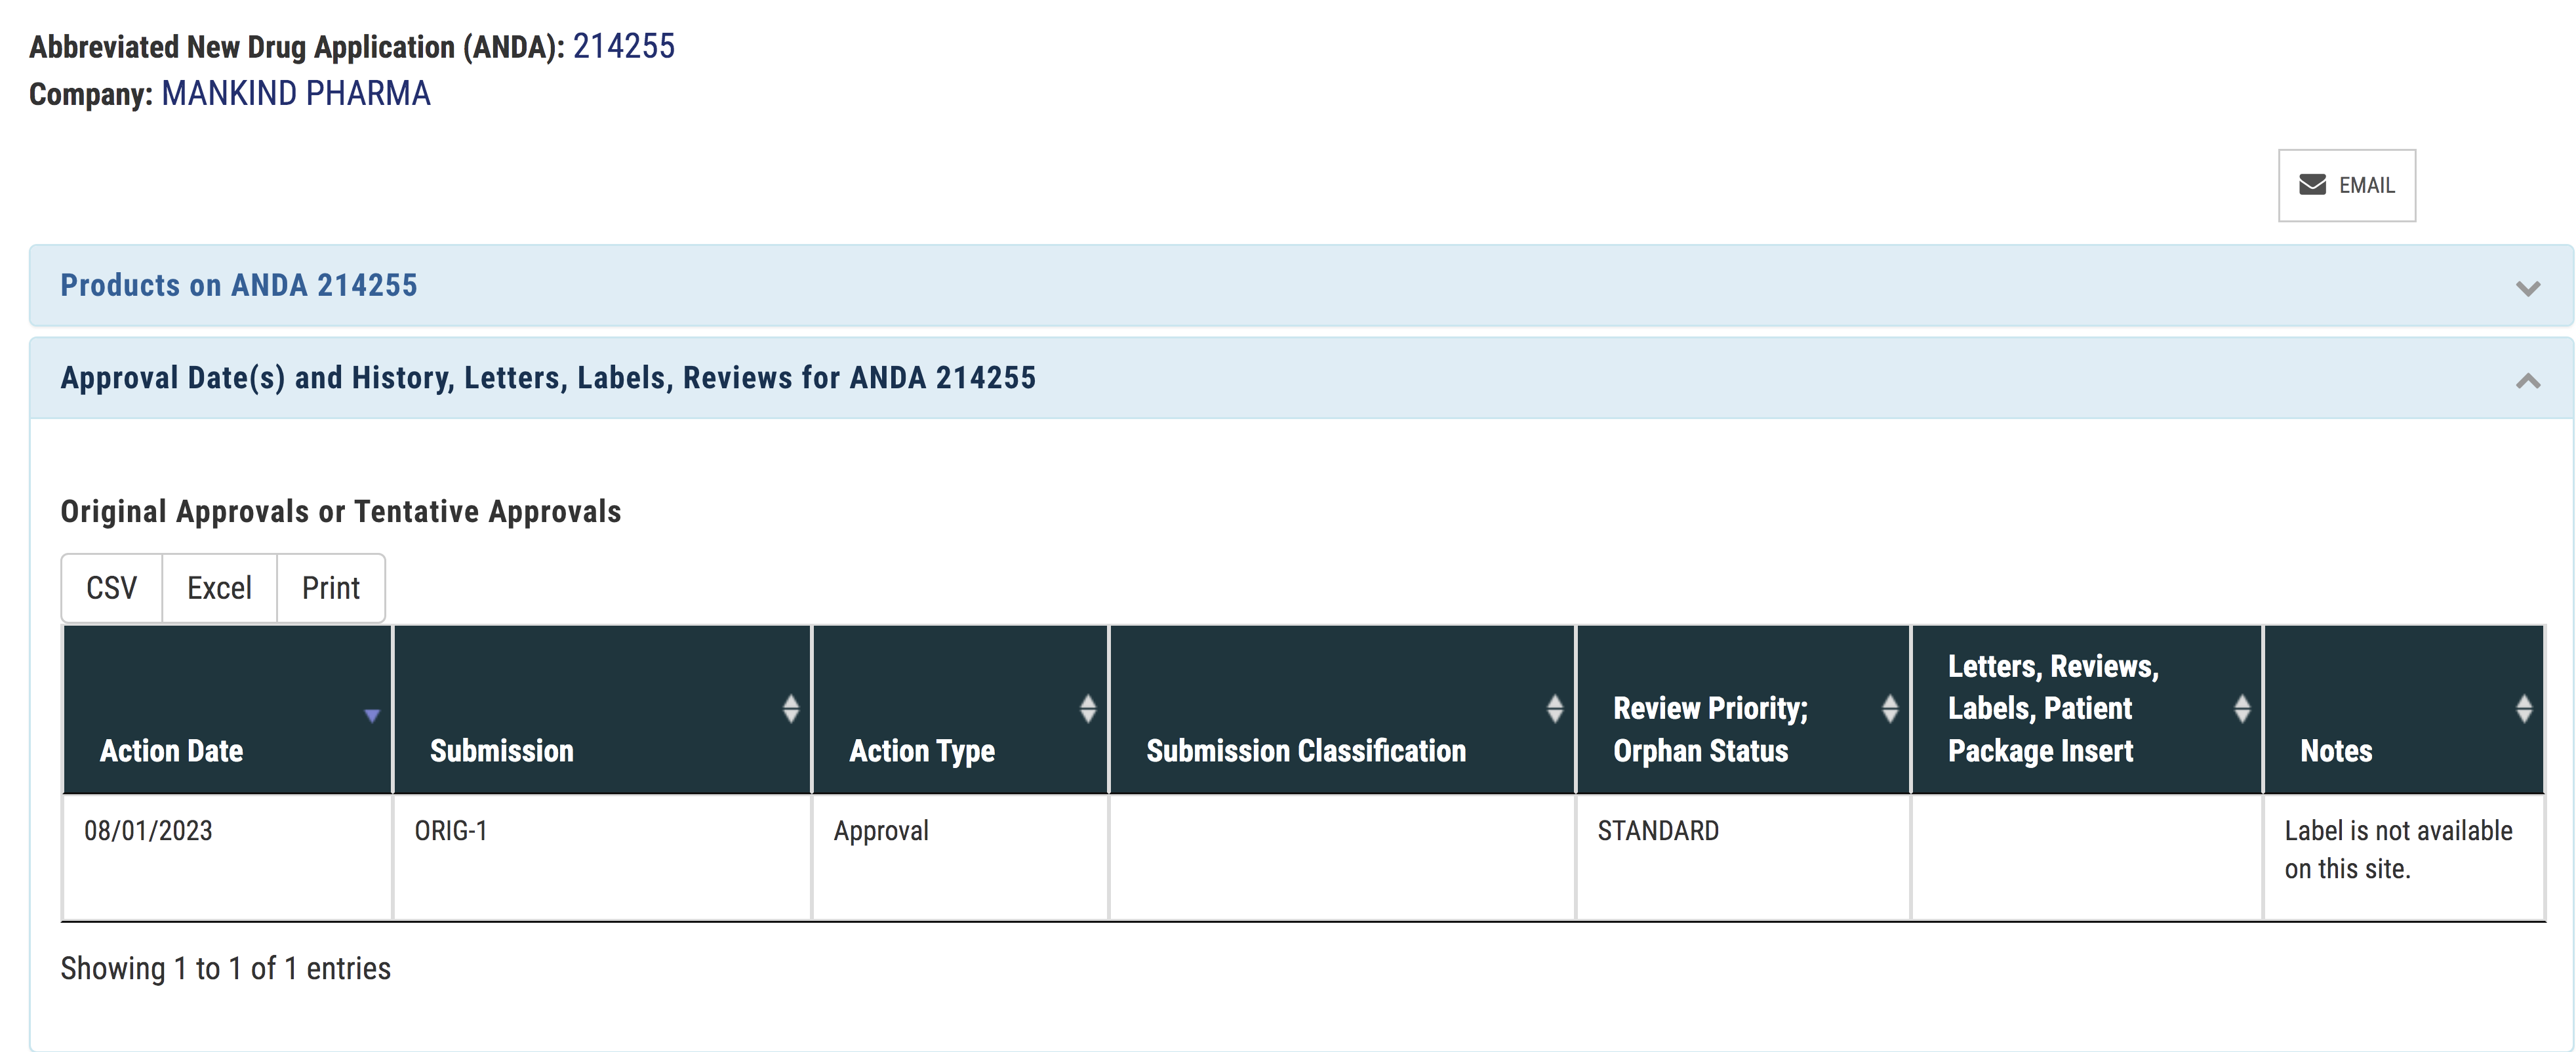
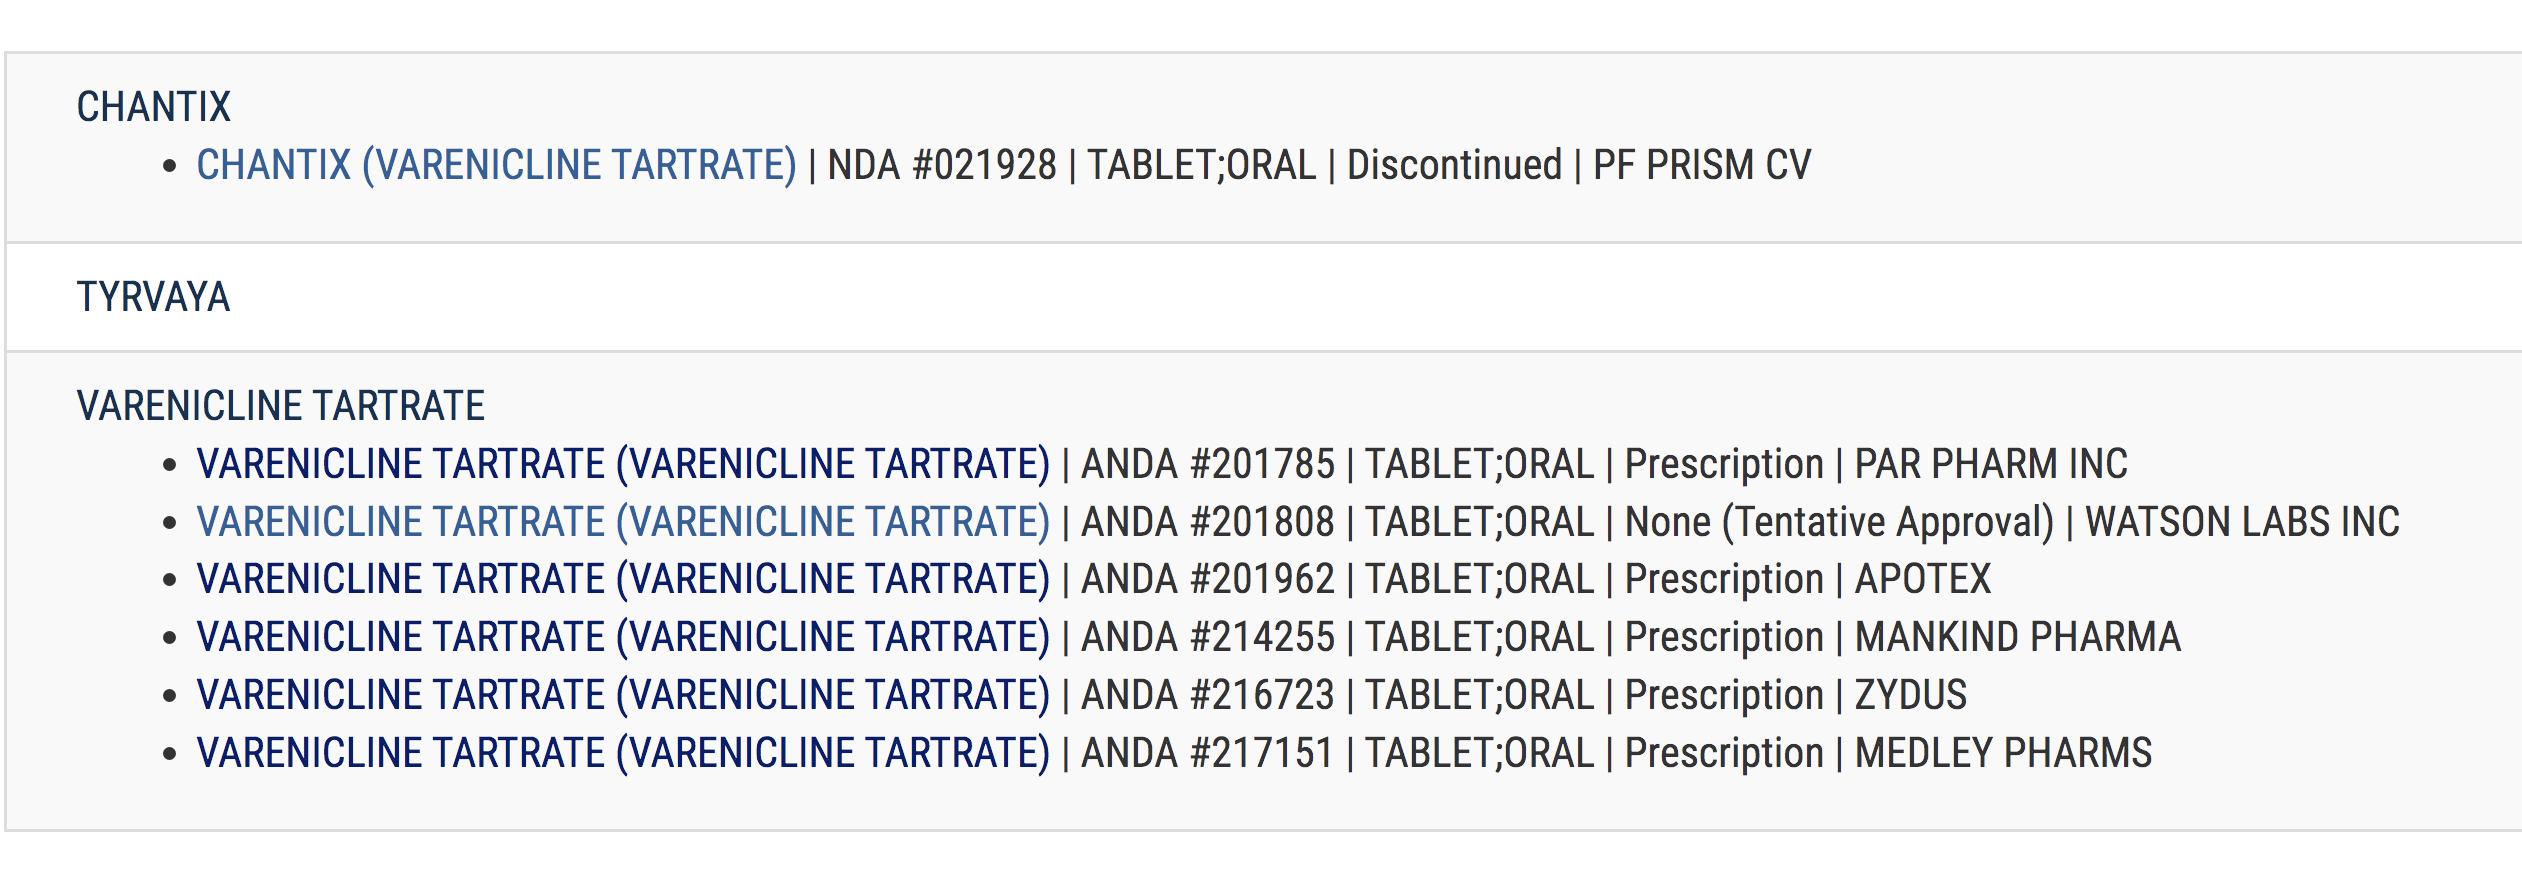
Mankind Pharma – Next Big Pharma Player? (24-08-2023)
I dont think Mankind ever disclosed this, but they recently got approval for gChantix which is a large product ($500mn sales in March 2023) with limited competition
Disclosure: Small investment (bought 1 lot during IPO)
My portfolio updates and investment journey (24-08-2023)
Thanks Shakti and Sandeep for your responses. Thanks to all who keep liking my posts.
@Shakti_Srivastava construction and capital goods is the area where I have not built my competence. However, I will keep my eyes and ear open for any future opportunities.
Sandeep, I do not look at the cost when looking at % allocation, I look at them from current market value levels only. Warren Buffet also answered this recently Warren Buffett: Ignore Original Costs When Reviewing Your Portfolio | The Acquirer’s Multiple® . However, people who just spray and pray (like having 100s of stocks) they should look at cost allocation only.
My rationale on XPRO India (3% allocation, 67% profit): First time I bought XPRO in February 2023 at 550 rs. My average cost is 560 rs. My last transaction (buy) was in March 2023.
First time I came across XPRO was when I was screening for Malabar Fund’s investments may be in February 2022 or March 2022 that time its price was ~1000 rs. The price had shot up some 40-50x in one year. So I did not muster the courage to buy it. I kept reading about the company. Valupickr (Xpro India – getting bigger? – #5 by sahil_vi) and Sahil Sharma on Twitter (https://twitter.com/sahil_vi/status/1614152532946821123) has good content on analysis.
XPRO historically been in commoditized Coex plastic films which accounted for over 70% of the revenues (I think single digit EBITDA margins). However, revenue mix is changing towards biaxial dielectric films which are used in capacitors. EBITDA margins of dielectric films is 25%+. Capacitors growth is going to be exponential given so much of electrification and increase of electronic items. Further, this product is straight away import substitution as everything else which XPRO does not manufacture is getting imported.
The business seems to have great moat as to expand one line business it takes about 3 to 4 years. Many customizations to SMT lines are required for production. Additional comfort was that it is from Birla group.
I kept eyes on stock and was able to buy it at ~550 rs. Lucky to get that price.
Disclaimer: I am not a financial advisor and nor a SEBI registered Analyst. The content shared here is only for learning purpose. All the names mentioned here are for example and learning purpose. I may buy more, exit or partly sell the stock/bonds without any prior intimation.
Zoom webinar on stage investing (24-08-2023)
Please add me to the list
Zoom webinar on stage investing (24-08-2023)
Please add me to the list.