
Company declared 39 Rs special dividend
A nice investor presentation:
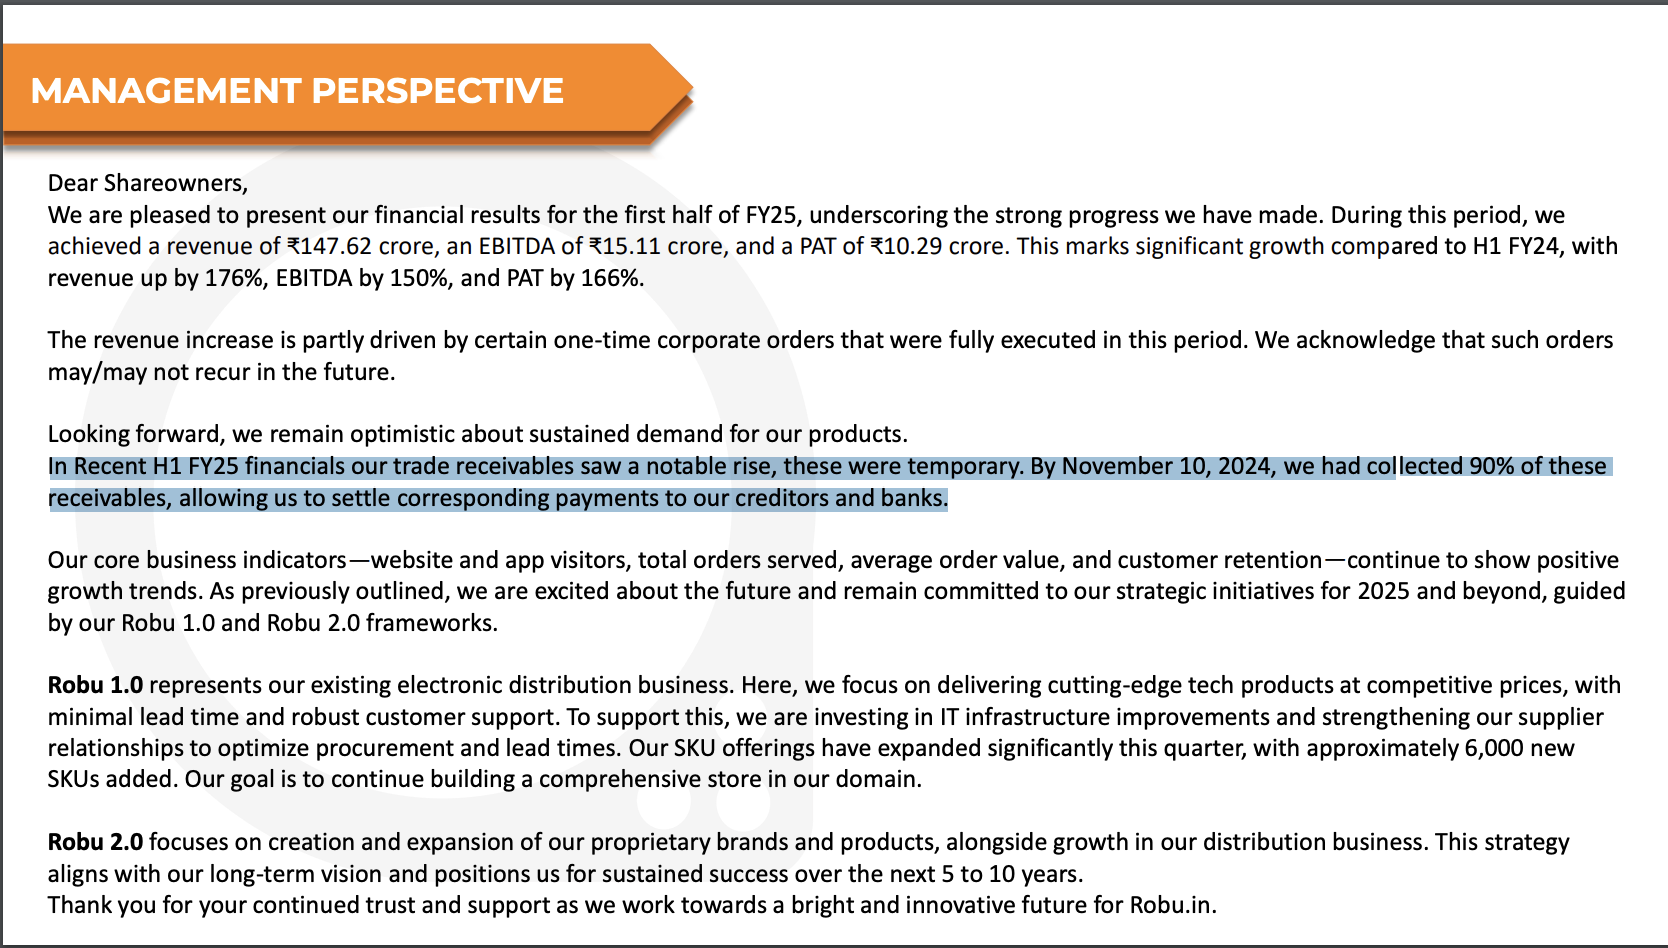
Hi management commentary on receivables. That they have collected 90% of the receivables mentioned in financial statements
Natco reported strong Sept 24 quarterly results. Reported total revenue of INR 1434.9 Crore for the second quarter of FY2025 that ended on 30th Sept 2024, as against INR 1060.8 Crore for the same period last year, reflecting a growth of 35.3%. The net profit for the period, on a consolidated basis, was INR 676.5 Crore as against INR 369.0 Crore same period last year, showing robust growth of about 83%.
As per Investor presentation, key Para IV pipeline now includes Tabrecta (Capmatinib) as sole FTF and Jevtana (Cabazitaxel) as shared FTF, tried figuring out the opportunity size in US, but unable to get the relevant data.
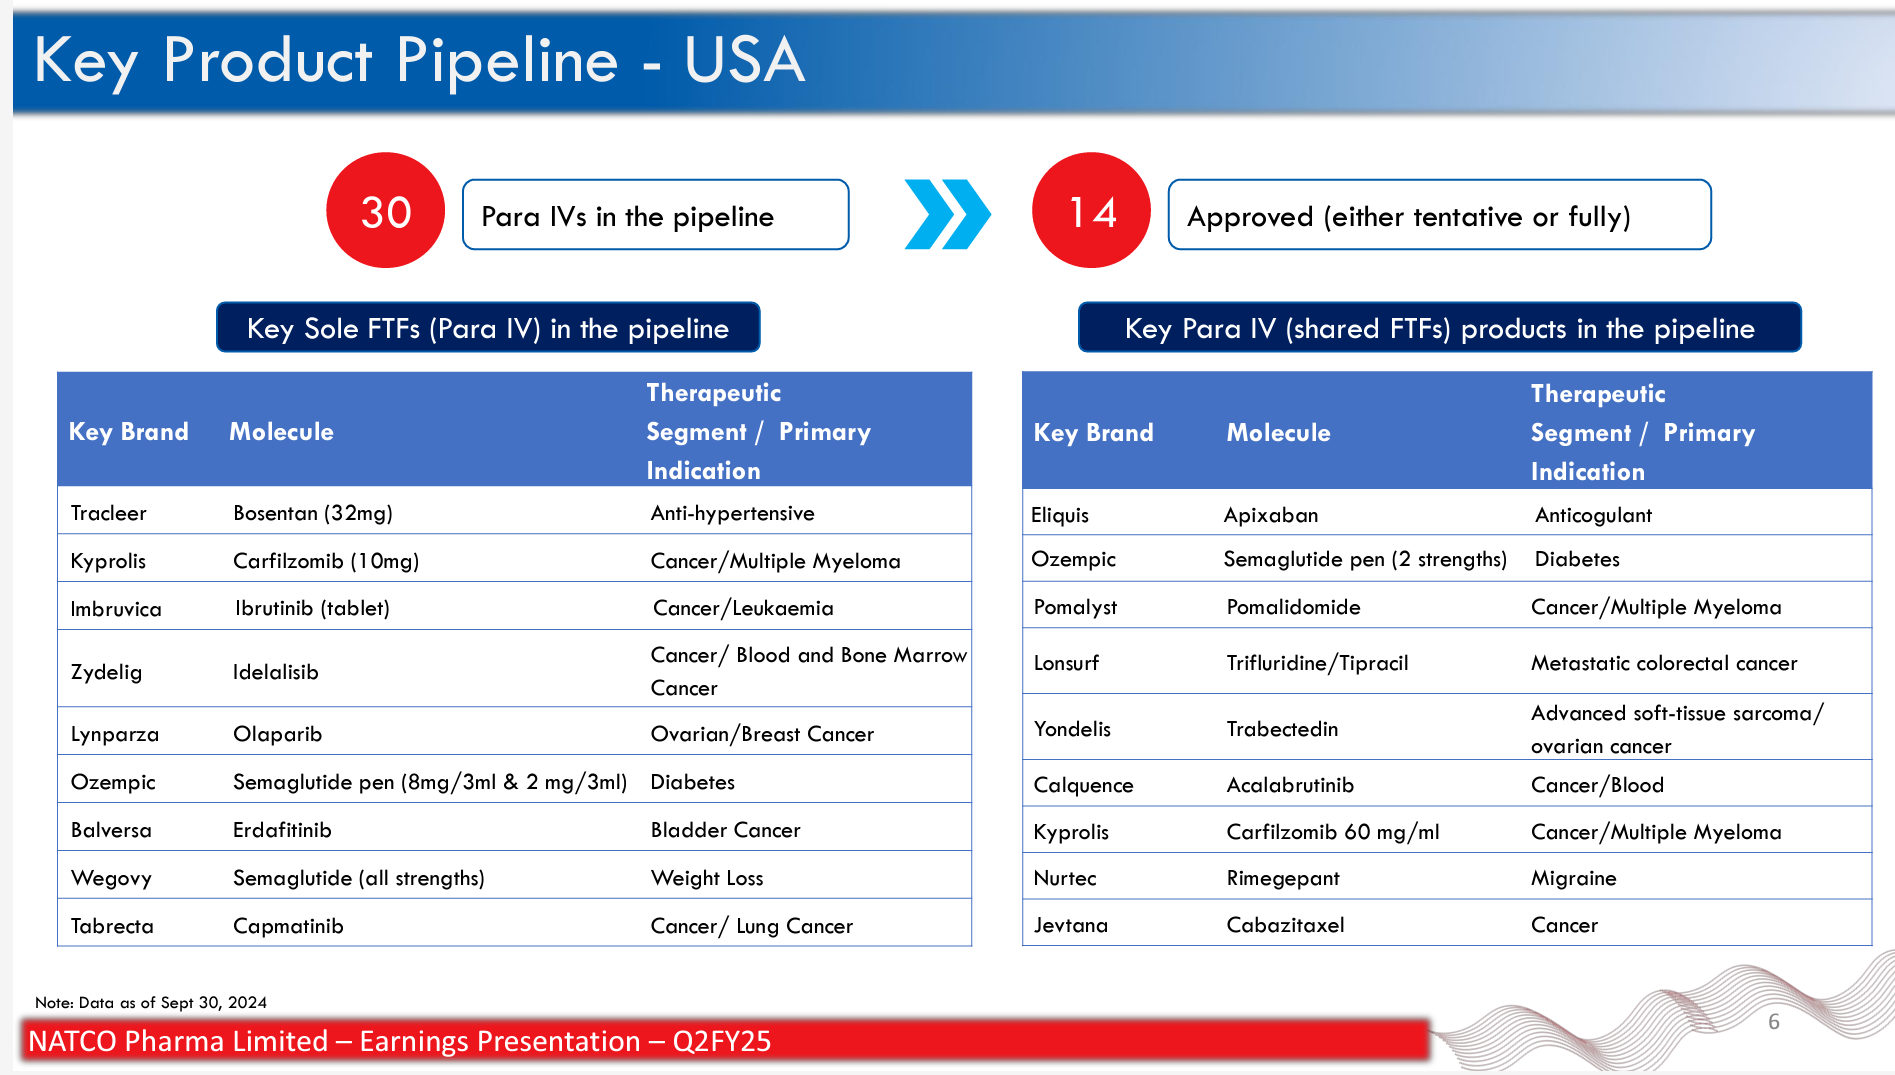
If anyone in valuepickr board have insights on the size of these opportunities, pls share. Thanks
I believe only thing which keeps the price from going up is the debt they have…had this been a low debt company the re-rating would have happened by now…
They mentioned “2% plus” estimate for the year and not 2%
Summary of concal transcript.
Worth going through the transcript to understand the clarity of thought of the management and opportunities lying ahead for the company.
Opening Comments of the Management.
We have generated a free cash flow in H1 FY25 of INR45.8 crores. We also repaid some part of our debt of around INR17.1 crores for the H1FY25. Consequently, our net debt position stands at a negative of INR94.3 crores.
As part of our investments in facility upgradation, we have invested INR103.5 crores in capital spend during H1 FY ’25.
While we expect FY25 to be flat, we remain confident that our business will regain momentum from FY26 based on significant order pipeline and strong customer demand. Overall, we continue to be cautiously optimistic about the future potential that our business holds.
Over many years, we have been consistently positioning Neuland as a dedicated API solution provider with extensive complex chemistry capabilities, partnering both with innovators as well as generic pharmaceutical companies.
Our business is uneven due to the inherent characteristics of the CDMO business as well as the specialty GDS business, which is focused on small volume products.
Annual progression is always a better indicator of the company’s prospects than a quarter-on-quarter performance. This quarter’s performance has been poor, especially when compared with what we’ve been doing over the last several quarters. But as I mentioned earlier, it does reflect the lumpy volatile nature of our business.
Completion of additional manufacturing facilities this year, coupled with anticipated commercial launch of molecules on CMS side, gives us the confidence of achieving high growth in FY26 and beyond.
We continue to see increasing interest in customers looking at Neuland as their CDMO partner.
In terms of the macro picture, we are yet to see significant impact of the Biosecure Act by way of active RFPs or orders, but we believe that the environment remains highly favourable for us in the medium to long term.
In terms of our biotech clients being acquired by big pharma, we see the continuity of customer engagement and are quite excited about the future opportunities and possibilities.
Although there was some volatility in our specialty business this quarter, we remain optimistic about the full year prospects for this segment, considering our customers’ expected growth.
we now anticipate closing FY25 relatively flat compared to the previous comments we had made about expecting a moderate growth for FY25.
Time and again, there is new information about products made by Neuland in the public domain. While the information may be accurate, I would urge you not to correlate such news with short-term business performance.
Regarding future capacity building, we are on track to complete the new production block in Unit 3 by FY25 and expect to commence commercial production in FY26.
We continue to seek growth through high-value molecules of innovator companies. We are committed to enhancing customer experience, which we believe sets us apart as a unique API provider.
Our investments in expanding our capacity and capabilities are also to be seen as a testament to our commitment to the future. By staying true to our core principles of customer focus, agility and operational excellence, Neuland is strategically positioned to seize opportunities even as we continue to navigate any short-term challenges which come our way. We continue to make progress on our long-term goals, which gives us confidence in delivering healthy growth starting in FY26.
Tactonic Shift
On reference to gaining companies with larger pipelines : I think just refers to the M&A environment that Neuland has been exposed to in the last couple of years. What has been happening is some of the programs that we’ve been associated with traditionally start by working with biotech companies are resulting in these companies getting acquired by larger companies. This has happened in more than one case. And that has been one opportunity where we are now engaged with companies with larger pipelines.Typically, Neuland’s growth has been with biotech companies which have had only 1 or 2 drugs in the pipeline. And during that period, the growth opportunity with a particular account was limited. But now as we are engaged with larger companies, which have started working with Neuland through M&A. We are just seeing an increasing possibility of new business through the same account because of these larger pipelines.
Compounding Effect
Other than that, organically, also Neuland has been now because we’ve been in the CDMO space for over 15 years, we’ve also started seeing traction with larger companies organically, where there is no biotech acquisition happening, but large companies have started to show interest with Neuland.
(Business scenario for existing structure)
There is clear evidence of a lot of new biotechs coming and talking to us because the funding environment also has improved in the US and that has also resulted in more traction. And somewhere, we also get a sense that perhaps in the China versus India narrative, there is a little bit more tailwinds towards India, which is also leading for more biotech companies to come and have conversations with us.
China+1
In one case, the projects have moved out from a Chinese CDMO and Neuland is kind of taking over these projects. In the other case, we are organically setting ourselves up as the partner for the clinical supplies. I think both are exciting programs, but it’s very important to remember that the probability of success is very low at this stage. I think there is generally a lot of work happening in CNS and these molecules also seem to be in that space. But one of them, which you may be interested to know is moved from China to Neuland. So those are the inputs I can share with you
Potential of approved molecules.
There are about 2 or 3 molecules which are kind of one step away from commercialization for Neuland. (Near term molecules for commercialization). Top 5 products in CMS are 90% I think, are still several steps away from becoming big revenue contributors. I think there’s one in COPD and then there’s one in CNS, which are programs which are maybe about a step away. I think these programs could potentially be large contributors for our CMS business, maybe starting from 2027.
Additional molecules apart from existing Pipelines:
And I think we are also pursuing some new projects where we are trying to get into some Phase 2 or Phase 3 programs. There’s also a pursuit of already recently commercially approved drugs where we want to enter as a second source. Those could be also probably more short-term opportunities for strengthening the commercial side of the CMS business.
Revenue Mix CMS and GDS
I think the CMS business is going to grow. I think if you look at the commentary we’ve made, I think in proportion to the GDS business, yes, I think it’s kind of around the 50% mark. It’s likely to go up beyond the 50% mark, but we are not really commenting on what the mix should be because both businesses are very independent of each other. And therefore, I think depending on how they perform, those numbers could move up and down. So, I think where we are currently, I think, is a fairly reasonable balance between GDS and CMS. I think we see strong growth in CMS in the next couple of years. So, we think that it should be above 50%.
Biosecure Act
GDS specialty business margins and the CMS business margins are not too far away from each other. They’re very similar margins. I think if you look at how we did in FY24, I think those margins were real margins. I think going forward, we think if the factors are very favourable, then the margins should be like that, or they should come down a little bit. (Margin Profile CMS & GDS)
One is when we’re talking about the whole momentum for business, the Biosecure Act India versus China, what we are doing in Neuland, is making sure that we are really keeping a close tab on what’s actually happening in the market rather than getting carried away by all the press that’s coming on the Biosecure Act and what is expected to happen in the future. We’re in touch with our customers. We’re engaging with them, finding out their preferences, how many projects are being outsourced, how many are going to China, how many come to India so that we keep our expectations, our projections and the related capital expenditure much closer to reality rather than get carried away by all the rhetoric that’s happening in the market. So that’s one thing that we’re doing at the strategic level.
HR Matter
As far as manpower and R&D is concerned, I think your observations are absolutely right. We’ve tried to maintain the headcount very close to what we expect the demand and the growth of the business to be. Notwithstanding that, over the last several years, we have focused more on the quality of manpower and specific skills of manpower that we are recruiting rather than just numbers of manpower. There’s not one thing any company can do to retain manpower. It’s always a combination of several initiatives from making sure that we are recruiting the right people, people whose purpose is also aligned with the purpose of the organization. We see that, today, the manpower, they actually want to work for good companies, companies that have a vision, where there’s a lot of stability. They have a purpose. They’re passionate about what they’re doing. And those are the kind of people that we’re also recruiting. We have a scientific as well as a manufacturing advisory board with very qualified accomplished scientists, engineers on there. And we use that network, including the network of our customers to identify the right kind of people for the organization and recruit them.
We use a combination of tools such as exit interviews, retention bonuses, employee engagement surveys to identify what are the top 3 or 4 things that are keeping our teams completely engaged. What are the top 3 or 4 things which are actually creating any kind of demotivation? We’re constantly working to overcome those so that we have a workforce that is passionate and engaged into the business.
Notwithstanding that, we also focus a lot on doing our annual customer surveys, and we always make sure that our teams are completely connected to how we are impacting the customer on an ongoing basis that keeps us motivated as well. So there’s multiple ways we could go on, but these are the top 3 or 4 things.
Neuland Core Strength and strategy
So, the way we see at least Neuland strategy play out in the future is that we want to focus more and more on technologies, which are challenging that will continue to differentiate Neuland that will help us continue to focus on the quality of business rather than the quantity of business. And that’s been a single-minded focus over the last couple of decades, and that’s why you’ve seen the margins of the business also grow. I think in areas where Neuland has positioned itself and wants to continue positioning itself in the future, as Saharsh was saying, our goal is to build that depth of expertise and that specialization, which we believe that has brought Neuland to where it is, and that’s what we look forward to. when we look at our list of molecules, both on the generic side as well as the CDMO side. We don’t find too many competitors from China. What China has done is that it’s invested a lot of money as well as technology for large-scale manufacturing to take on the scale. Whereas we’ve invested, as Saharsh was saying earlier, on a lot of capability development, skin development, specific technology, specific IP, and that’s how we’ve developed our molecules. So going forward, unless it is a very large volume API, we do expect competition from China, but we don’t expect competition on each and every molecule. I think it will be limited to a few molecules. Notwithstanding that, within the organization, we do have a process of life cycle management where we benchmark our costs globally across competitors, whether it’s Europe or China, and we are constantly looking at ways to invest in technology so that we can also continue to stay competitive.
So long story short, I think we’re always looking at China, at Europe. We are constantly benchmarking our costs. We are benchmarking what our prices could be 5 years down the line. And we are actually initiating projects within Neuland now that will keep us competitive even 3 or 5 years down the line as well.
whatever business we have seen shifting out of China or even shifting out of Europe coming to Neuland, price has not necessarily been or a price target has not necessarily been the key consideration for us. It’s always been driven by either technology or a capacity need or a batch size requirement. And price obviously plays an important role, but we are not so much driven by the customer on pricing. I think Neuland, as Sucheth said, because of our generics business expertise, we tend to work towards cost leadership. But it doesn’t so happen that a biotech company sets us a cost target, compares us with a Chinese source and drives us towards that. Neuland has never competed as a low-cost producer, as we were clarifying earlier. We’ve always competed based on our technology, our ability to meet the price targets set by the customer, the supply requirement, the capacity requirements, so on and so forth. So, we’ve never really positioned Neuland as the lowest cost producer in order to get business, and that’s not part of our strategy going forward as well. we continue to focus on where Neuland can add value, what are the molecules that we need to invest in, where do we need to create those capacities. Those are the areas that we continue to focus on.
Scientist required for Molecules
Our focus is very narrow, right? We are an API company. We do API CDMO work. And therefore, for us, the kind of scientific staff we need per molecule or the scientific staff we need is also comparatively lesser. When we are engaged in doing a lot of work that involves maybe medical chemistry or early-stage drug discovery work, the need for scientists is a lot more. I think since Neuland is not in that space, I think with a team of 7 scientists, we are able to develop a molecule which can be a multimillion-dollar product. And so, I think there is a little bit of a comparison issue over there. You mentioned GLP in your opening remarks. Now a GLP-1 kind of a molecule, which Neuland is making one for generics for the GDS business, takes a team of maybe 8 scientists, 2 to 3 years to develop a GLP-1. What’s important is the quality of the scientists, which is what Sucheth was emphasizing on.
Challenges and strategies in getting business from Big Pharma
The challenge that companies like us, which are more emerging on the CDMO space is that big pharma already have a lot of qualified suppliers in their network, and it takes a lot of effort to displace an existing supplier network. Moreover, the big pharma also continuously try to consolidate their supplier network because it is also administratively difficult for them. So, one strategy which we have talked about in the past is when any of our existing CMS customers like biotech companies get acquired by big pharma (Karuna by BMS for KARXT), we use that opportunity to build trust and goodwill with the big pharma and then try to not only continue the current business but expand into new business. So that is one way to do it. Another way to do it is to actually acquire technical capabilities, which are unique and not available with the big pharma’s existing network. So, for example, one area we’ve been working on like that is the area of peptides. Now Neuland has been one of the few companies who’s been working on peptides, both for the CMS side as well as on the GDS side. Now peptides are not being offered by a lot of other CDMOs. So, it could be a vehicle to attract big pharma, and that’s one way to pursue it. There could be other technologies which we might invest in and build on. Those could be ways in which we could try to attract big pharma as well. It is a longer process. So therefore, we have to kind of be continuously at it. And hopefully, we will be able to have a strong big pharma portfolio in Neuland as well.
Future Growth Potential
I think the new business component is intact. I think whatever we wanted to do as new business for the CDMO business, I think has been coming on track. I think if some things are have led to us to change our outlook from moderate growth to flattishness, I think it’s more because some things have right shifted either because of some execution delays or because our customers want us to kind of move things out. But nothing to do with dampening of new business or business prospects. It’s just how things are falling into place. Going forward on the specialty side, we are becoming more selective in terms of the kind of products we are filing. We are looking at peptides as part of the product portfolio. So, our team is working on a peptide called Difelikefalin for which we expect to file the DMF next year. There’s tirzepatide, which is a GLP-1, which we are working on for which we hope to file a DMF maybe the year after next. And then there are a lot of other small molecules as well. We expect that these molecules should drive growth may be from 3 years and beyond. I think the growth in the next 1 to 2 years should be driven by the DMF filed already. On the CMS side, we want to continue expanding our current relationships with the innovator companies. We have a portfolio of maybe almost 80-plus projects, out of which there are at least 25, 30 customers in which we have deep relationships. Our idea would be to expand on those relationships. Other than that, also our priority is to focus on technology. And I think as Sucheth and I had elaborated previously in the call, we want to invest in newer technologies like peptides and maybe even beyond that and use those technologies to try to acquire newer projects. The goal would be to stay within the active ingredient space, not really venture into any other areas. And the goal would also be to stay in human health areas. That way we are able to stay focused. I think we have a plan for the next 7 years charted out, and it’s fairly exciting. It involves us to stay focused in this active ingredient space, but it will require us to venture into some newer technologies, which we will make investments in a timely manner. So, I think that’s how the picture is looking at, and it’s quite exciting for us. So, it’s just a high-level view of what the next 5 years is looking at for us.
Thanks for the detailed explanation and your time.
And yes it’s is inline with what I had heard from one of my friend who works in gulf as an actuarial consultant for oil company in omen.
I can resonate well with this point.
And one more question on the personal level, in your opinion how much of the growth has already been baked into the CMP (in terms of percentage)
Once again appreciate your time to clarify and educate on topic. Thank you