NSE data comes in multiple categories, EQ, BE etc. It is quite possible for the dates that you are referring to, the stock has gone to BE category.
When you want to check the data on NSE, click to show all categories and then it should be fine.

NSE data comes in multiple categories, EQ, BE etc. It is quite possible for the dates that you are referring to, the stock has gone to BE category.
When you want to check the data on NSE, click to show all categories and then it should be fine.
Senco Gold –
Q1 FY 25 concall and results highlights –
Current breakdown of number of showrooms –
Company operated – 97
Franchise showrooms – 68
Total – 165 ( spread across 109 towns and cities and 01 in Dubai )
Added a total of 06 new stores in Q1
Q1 financial outcomes –
Revenues – 1403 vs 1305 cr, 7.5 pc
EBITDA – 108 vs 67 cr, up 62 pc
PAT – 51 vs 27 cr, up 85 pc
Same Store sales growth @ 4 pc
Avg Ticket value @ Rs 73.9k vs Rs 63.7k for FY 24
Q1 Stud ratio @ 9.9 pc vs 11 pc for FY 24
( diamond sales were down by 3-4 pc in Q1 – due rising gold prices )
**Sale of recycled gold stood at 35 pc of total sales ( ie customers exchanging old gold ornaments for new ones ) **
Have launched lab grown diamonds under the Sennes brand
Aim to add about 12-14 more stores in FY 25
Aim to add about 12-14 more stores in FY 25
About 95 pc of company’s gold stocks are hedged. Due to the sharp duty cut on Gold imports announced by the GoI ( recently ), there will be an adverse financial impact of about 50 cr for the company for the remaining 9Ms this FY. However, the duty cuts have also stimulated the demand for gold and gold jewellery which should help the company offset this impact
Aim to grow topline by 18-20 pc for FY 25 vs FY 24
Depreciation charges in Q1 are 18 vs 12 cr ( up 50 pc YoY ) – mainly because of aggressive store opening in FY 24
Confident of touching a stud ratio of 12 pc for full FY 25
Growth in Q2 ( as on the date of Concall ) has been a whopping 25 pc ( triggered by duty cuts ). Hence the confidence to guide for a 18-20 pc topline growth for full FY ( with same store growth guidance @ 11-13 pc )
Also seeing healthy growth in Franchise stores in Tier -2,3 towns – probably an indication of improvement in rural economy and normal monsoons
Elevated levels of other expenses in Q1 are unlikely to continue wef Q2. The same were elevated as the company was spending a lot on brand promotion / marketing etc as the Mkt was showing weakness wef late May / Jun
Company is confident of making up for a large part ( if not for the full part ) of inventory losses of around 50 cr in the next 3 Qtrs – due increased sales, lesser discounting etc
To be on safer side, company is guiding for 15-18 pc bottomline growth for FY 25
Disc: holding, biased, not SEBI registered, not a buy sell/recommendation
Please find link to the latest spreadsheet.
Senco Gold –
Q1 FY 25 concall and results highlights –
Current breakdown of number of showrooms –
Company operated – 97
Franchise showrooms – 68
Total – 165 ( spread across 109 towns and cities and 01 in Dubai )
Added a total of 06 new stores in Q1
Q1 financial outcomes –
Revenues – 1403 vs 1305 cr, 7.5 pc
EBITDA – 108 vs 67 cr, up 62 pc
PAT – 51 vs 27 cr, up 85 pc
Same Store sales growth @ 4 pc
Avg Ticket value @ Rs 73.9k vs Rs 63.7k for FY 24
Q1 Stud ratio @ 9.9 pc vs 11 pc for FY 24
( diamond sales were down by 3-4 pc in Q1 – due rising gold prices )
**Sale of recycled gold stood at 35 pc of total sales ( ie customers exchanging old gold ornaments for new ones ) **
Have launched lab grown diamonds under the Sennes brand
Aim to add about 12-14 more stores in FY 25
Aim to add about 12-14 more stores in FY 25
About 95 pc of company’s gold stocks are hedged. Due to the sharp duty cut on Gold imports announced by the GoI ( recently ), there will be an adverse financial impact of about 50 cr for the company for the remaining 9Ms this FY. However, the duty cuts have also stimulated the demand for gold and gold jewellery which should help the company offset this impact
Aim to grow topline by 18-20 pc for FY 25 vs FY 24
Depreciation charges in Q1 are 18 vs 12 cr ( up 50 pc YoY ) – mainly because of aggressive store opening in FY 24
Confident of touching a stud ratio of 12 pc for full FY 25
Growth in Q2 ( as on the date of Concall ) has been a whopping 25 pc ( triggered by duty cuts ). Hence the confidence to guide for a 18-20 pc topline growth for full FY ( with same store growth guidance @ 11-13 pc )
Also seeing healthy growth in Franchise stores in Tier -2,3 towns – probably an indication of improvement in rural economy and normal monsoons
Elevated levels of other expenses in Q1 are unlikely to continue wef Q2. The same were elevated as the company was spending a lot on brand promotion / marketing etc as the Mkt was showing weakness wef late May / Jun
Company is confident of making up for a large part ( if not for the full part ) of inventory losses of around 50 cr in the next 3 Qtrs – due increased sales, lesser discounting etc
To be on safer side, company is guiding for 15-18 pc bottomline growth for FY 25
Disc: holding, biased, not SEBI registered, not a buy sell/recommendation
Fellow investors, I will like to know your opinion on analyzing micro-cap NBFC’s.
A micro-cap NBFC in secured lending business which is currently in an expansion phase usually has a high OPEX/AUM due to which the RoA is subdued and subsequently the RoE is subdued as well. It takes several years before operating leverage kicks in. Since they are a micro-cap, the cost of funds is also high thereby impacting NIM’s & limiting leverage.
During this expansion phase, the micro-cap NBFC is growing its AUM at a break neck speed of +50% with RoE of about 10% (3x – 4x leverage). If they leverage more then the cost of funds might go up as their operations will be seen more risky, therefore, the most sustainable way for them to keep growing their AUM with a reasonable RoE at this pace is by raising fresh capital & diluting equity from time to time and gradually increase their leverage as they become bigger in size.
In such a scenario, an early investor will see continuous dilution of his/her equity, then how will such a stock truly become a multi bagger for an early investor? Have your experienced such a scenario with any company in the past?
Would it be safe to assume that the only reason why one should hold such a stock is that the management of such a NBFC is diluting its equity at a high price to book multiple every time?
Your thoughts and opinions on this subject will be highly appreciated as it will give a good understanding of how to analyze mircro-cap NBFC’s.
Don’t know who calculated it, but Time Techno hasn’t quoted at 28 PE for last 3 years (Disclaimer: been holding/adding Time Techno since 2019). It’s valuation is only now going up.
Only major common product between Pyramid & Time is IBC which is a big cubic polymer/fiber container used to transport chemicals. This is a value-added product having ~16-18% margins & Time has more capacity/sales vs Pyramid. Otherwise Pyramid is into metal drums a lot, which is very minor for Time.
Besides, as you’re going through Q1FY24 transcript & their FY25 projection, please chk their Q1FY25 to see if they can deliver as @hitesh2710 advised.
From Pyramid Q1FY25 transcript, their IBC business is affected by shipping crisis whereas Time (per Q1FY25 transcript) says they’re not affected. So I’m guessing Pyramid performance will be affected (atleast relatively) in FY25 also.
In the manufacturing industry, which is highly capital-intensive, it is generally advisable for a company to retain the majority of its profits. However, in the case of a mold packaging company, it is distributing 37% to 45% of its profits as dividends. Over the past 10 years, the company has been raising funds through debt, and in the last 3-4 years, it has also started raising funds through equity.
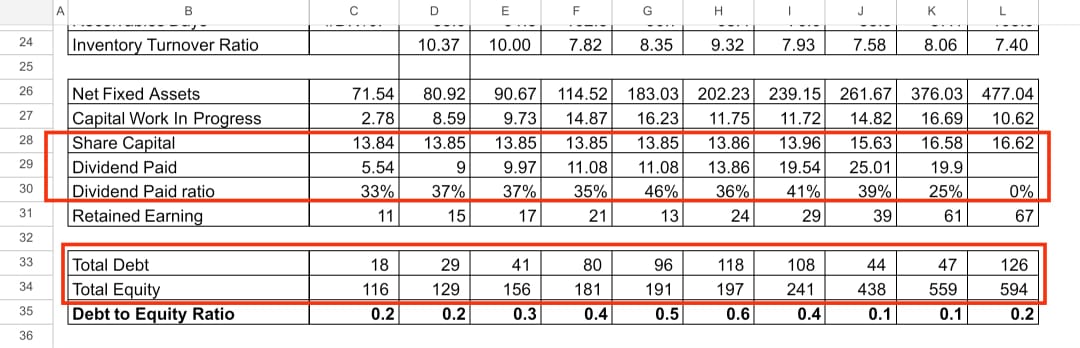
My question is: why is the company paying a 35% to 40% dividend while simultaneously raising external funds? Wouldn’t it be more prudent for the company to reduce its dividend payout and use those funds internally?
Hi Vineet! nice presentation with future projections. I would like to know what if HFL comes with their own brands resulting in increase in margins. I have read they have commenced with HFL Healthcare & Wellness Pvt Ltd. Welcome to HFL Healthcare and Wellness Pvt Ltd where focus is on their own branded healthcare products like Vitamins, Minerals & Nutraceuticals.
Please enlighten on this !
Thanks
These problems will keep occurring if we rely on non api data I guess. Google finance data can be used if we connect the script to a Google sheet. Also I don’t mind using my own kite historical API once a month for this purpose.
Absolutely!!! Lets collaborate.
If we script generically enough, we might be able to get the same sheet to work for both large. mid, small and micro caps, though we could initially limit our focus to small and micro caps as that’s in focus here.
We can message privately and then post back here once we have something meaningful to share