
So,is it good time for add
Posts in category Value Pickr
Shivalik Bimetal Controls Ltd (SBCL) (20-08-2024)
So, management commentary indicates the Q1 margins pressure is mainly due to product mix change and lower exports. That partially confirms the above reasoning. This also indicates that the shunts business requires lot more material than bimetals hence the increased COGS. @diffsoft , What is your reading?
IREDA: Renewable Energy Powerhouse (20-08-2024)
IREDA Shareholding Pattern

Disc: Invested
IREDA: Renewable Energy Powerhouse (20-08-2024)
IREDA Shareholding Pattern
Disc: Invested
Amrutanjan Healthcare – Finally Waking Up After 100 years? (20-08-2024)
Based on @AdiSen ‘s table calculation, I have set up a quick calculation to derive the market’s view on Amrutanjan’s stock. The approach simply takes the current stock level (Rs 775 as of 20th August 2024) and dissects what expectations the market prices in, with the fundamental data as a starting point (as provided in Amrutanjan’s Annual Report).
Our goal is to estimate the value of the company and compare it to the current market level of the stock. The outline of this post is as follows:
- Project management’s guidance and derive the financial implications until 2028
- Estimate the Shareholder Value based on management’s guidance
- Compare the derived value with current market expectations
- Examine market expectations
- Conclusion
- Discussion of assumptions
Assumptions
The core assumptions are as follows (please refer to my discussion of these assumptions – Part 6 – at the end of my post):

Management’s Guidance And Financial Implications
Amrutanjan’s management has provided the guidance to reach sales of Rs1000 crs in 2028. With current sales levels of Rs421 crs, this implies a sales growth rate of 24.15% (see The Hindu Article: Amrutanjan Health Care eyes ₹1,000 cr. revenue by FY28, , provided by @Seinfeld above). This yields the following sales growth trajectory:
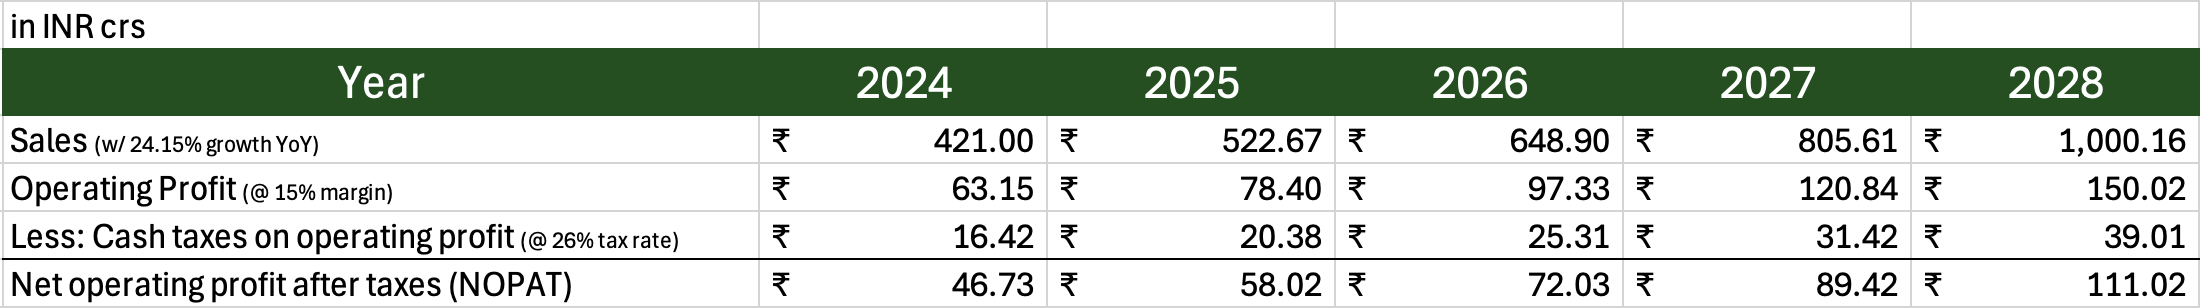
Every Rupee of incremental sales requires a corresponding increase in investment in fixed capital (capex minus depreciation) and working capital (expanding inventory, provisions for losses, trade receivables and trade payables). Based on a quick research of the past 4 years of Amrutanjan’s business performance, I have assumed 1% of incremental fixed-capital rate and 30% of incremental working-capital rate. In other words: if Amrutanjan wants to earn 1 additional Rupee of sales, it has to invest 1 Paise in fixed capital and 30 Paise in working capital in the preceding period. Applying these assumptions to the calculation:

2. Value Company Based On Management’s Guidance
2.1 Present Value of Future Free Cash Flow
If we subtract total investment from NOPAT, we arrive at Free Cash Flow (FCF). Discounting FCF at Cost of Capital of 13.50% gives us the Present Value of FCF (to be precise: discounting at Cost of Equity, because company has zero debt – thanks @Dushyant_Mishra). Adding up these expected future FCF’s tells us, what Amrutanjan’s future cash flows should be worth to us in today’s terms, as shown below:

In other words: when management provides the guidance that it will reach Rs1000 crs of sales in 2028, we should expect to earn a total Free Cash Flow of Rs150.94 crs in the years from 2025 to 2028 (26.50 crs + 32.90 crs + 40.84 crs + 50.71 crs = 150.94 crs). The Present Value of FCF is 107.37 crs (discounting at 13.50% for every period).
The implied Return On Incremental Invested Capital for the time period from 2025 to 2028 is 44.45% YoY. As an example, take the year 2026: The increase in NOPAT from 2025 to 2026 of 14.01 crs (= 72.03 crs – 58.02 crs) divided by the total investment of 31.52 crs made in 2025 yields an ROIIC of 44.45%.
2.2 Present Value of Continuing Value
What happens after 2028? No one will ever know for sure, but the probability that Amrutanjan is still around is high, so we can expect that the company will generate future cash flows as well. However, an ROIIC of 44.45% YoY is very attractive and invites competition, which will drive down future returns towards the cost of capital. Unless Amrutanjan has a wide, deep and protective moat, it is unlikely that it can fend off fierce competitors and sustain this ROIIC.
For estimating the continuing value after 2028, this means that Amrutanjan will be around nonetheless, but that it won’t earn excess returns (defined as a positive difference between ROIIC and Cost of Capital). Given it’s strong brand awareness I assume that Amrutanjan will be able to raise prices in line with inflation. Using the perpetuity method with inflation-adjustment (inflation at historic rate from 1960 – 2023 of 5.5%), the Continuing Value in 2028 will be 668.69 crs, which is 402.94 crs if we discount it back to the Present Value.
2.3 Estimating Shareholder Value
Adding the Present Value of Future Free Cash Flows (107.37 crs) and the Present Value of Continuing Value (402.94 crs) gives us a Corporate Value of 510.31 crs today. When adding the nonoperating assets that can be found on the balance sheet (total of 237.12 crs) and subtracting debt (which in this case is zero) we arrive at a Shareholder Value of 747.43 crs in today’s terms.
3. Compare Derived Shareholder Value With Current Market Expectations
A shareholder value of 747.43 crs translates into a share price of Rs 255. However, the current share price is at Rs 775 – a premium of Rs 520 for every stock. The conclusion is clear: the stock is highly overvalued, and there is significant risk of a downward correction.
4. Examining Market Expectations
We have now derived the fair Shareholder Value (747.43 crs = Rs 255 share price). However, at a current share price of Rs 775, the market assigns a heavy premium on the company. What is implied in the current level of the stock?
In the above analysis, I have restricted the time frame to 2028 (based on management’s guidance). However, we can speculate and expand the time horizon while maintaining the same core assumptions.
How long do we have to expand the time horizon to justify a stock price of Rs 775? In other words, how long does the market expect Amrutanjan to grow sales by 24.15% YoY while maintaining an Operating Profit Margin of 15%, an ROIIC of 44.45% YoY, and a Cost of Capital of 13.50%?
The answer is: until 2040 – an additional 12 years beyond the current examination period (2025-2028).
This time horizon is also known as Competitive Advantage Period (CAP). Simply put, this means that the market expects Amrutanjan to have an competitive advantage that allows them to grow profitably while also fending off competitors until 2040, enabling them to earn excess returns of 30.95% (44.45% ROIIC minus 13.50% Cost of Capital) YoY.
Sounds too crazy to be true? I agree. Given that
- Amrutanjan operates in a highly contested market segment,
- Amrutanjan has big competitors (multiple times their size),
- There is no proprietary product recipes protected by patents,
- The average Competitive Advantage Period of a typical company is around 3-5 years, and
- The future is unknowable, therefore forecasting until 2040 is senseless,
we can safely say that the current market expectations are unsustainable and translate into significant risk for the investor. However, the most obvious explanation for this high discrepancy is the superficial nature of my analysis. There might be a valid reason why the market awards such a high premium on the company. But unearthing this reason requires a deeper analysis, which I won’t get into right now (if requested I might do so in the near future). Such an analysis takes a deep look on the competitive landscape, the company’s history, and the capital allocation skills.
5. Conclusion
Based on a price of Rs 775 as of 20th August 2024 and an estimated fair Shareholder Value of Rs 520 per share, the company is highly overvalued and poses a significant downside risk.
6. Discussion of Assumptions
This post is a quick and shallow analysis of Amrutanjan’s stock. I routinely analyze stocks in this manner to get a sense of them, and if I find high discrepancies (as in this case), I dive deeper. There are a few things to point out when reading on my analysis:
- The superficial nature of my analysis implies a high potential rate of error.
- The market is right most of the time; only in rare circumstances does the wisdom of the crowd turn into madness of the crowd. There is no evidence that markets are currently on the madness-side of things.
- The assumptions are based on very restricted data and may not be representative. Since they have a high impact on the outcome of the analysis, significant corrections are likely to occur when diving deeper.
- I am inherently fallible, and have no special insight or expertise into the industry and the Indian market. I am currently diving into India, and my lack of experience in the Indian market invites another source of error.
Hitesh portfolio (20-08-2024)
Sometimes, picture is more clear on GMMA chart as compared to a bar chart or a line chart. In those instances I use GMMA.
DHP India Ltd – Regulators and Fittings (20-08-2024)
@Lakshmi_Narasimhan_B : Would appreciate your latest views on this business touching upon AGM update, Q1 results, and sudden drop in revenue as well as profitability in the recent times.
E2E Networks Ltd – Listed small Cloud computing player (20-08-2024)
I find it odd that they raise Rs 420 cr in Aug and not a word about the fund raise or plans for deployment in the July concall! Secondy, wouldn’t debt have been better than diluting our holding? Plus the fact that the promoter is also diluting little by little.
Discl: I booked > 50% in late July because the valuations and the inbuilt expectations were making me uncomfortable. Needless to say, the subsequent price rise is making me even more uncomfortable! ;-)*
Kilburn Engineering – Huge undervaluation (20-08-2024)
Continuing further on my notes and views on the business –
Capital goods as a sector continues to have tailwinds. Historically the sector tends to have prolonged upcycles and down cycle. The cycle bottomed out in 2019-20, I think we easily have 3-4 years, before signs of a peak start emerging.
Don’t quite agree on this.
The company enjoys healthy cash on the books, has a manageable debt position, swelling order book and led by experienced management team. Base business / standalone entity has grown its revenue at CAGR of 40%+ in last 3 years. The order book has jumped by 51% from 212 cr to 324 cr. Enquiry pipeline has grown more than 2x YoY.
The management has a judicious and prudent approach when it comes to inorganic growth. The current factory unit with an asset turns of ~ 5x being a case in point. They believe in completing one acquisition at a time, stabilizing that business, and then pursuing the next one; rather than pursuing multiple acquisitions in a short span. Considering the healthy cash on books, won’t be surprised if they come up with another acquisition announcement towards the end of this FY / early next FY.
Synergies from the ME acquisition will start kicking in this FY; and we should see better margins too in coming quarters, aided by economies of scale and a better product mix. (Q1 FY 25 revenue for M.E was at 21 cr vs 5 cr YoY). Expecting M.E. to contribute approx. 65-75 cr in this FY. And around ~100 cr in FY26.
The newly acquired plant should start contributing to topline in Q4 (post completion of process by Q3). Going by the current run rate, expecting the consol FY 26 revenue to be around 730-750 cr (530~540 + 110 + 100).
Disc: Invested, biased