
Posts in category All News
Shivalik Bimetal Controls Ltd (SBCL) (06-11-2024)
So longevity of the designs are more than 15 years as a typical vehicle platform exists for 10-15 years. What changes are shapes and sizes of the shunt resistor based on battery pack design / power requirements / environmental factors etc.
ISA have 500-600 SKUs of shunt design. They used to patent this design at a discussion stage which became extremely inconvinient for the OEMs whenever they need to do slight modification or change the source. That is where new players like SBCL become extremely important from IP perspective.
Another thing to note is whenever a new shunt order or a design modification order comes, SBCL charges a tooling cost on that prototyping. Sometimes same OEM gives the order to multiple tier 1 and the tier 1 sends the same order to a few player. I came across an interesting instance where SBCL got the same prototyping order from 3 different Tier 1s.
The design, to approval to large volume delivery takes around 2-3 years as there are rigorous lifetime tests done on the components.
@Donald da, The module part is still unclear to me on whether they would become a full fleged module supplier. But it seems that the company is taking early steps towards becoming atleast a contract manufacturer for module components. Studying Tier 1s design freeze are a bit complicated at these stage as the SKUs would be even larger and there are no public information of it. These are custom tuned to the product’s requirment.
On the results with the US election and hopefully a significant policy push towards electrification, I feel that we will see good demand coming through in next 2-3 years.
Disc : I belong to this industry and significantly biased.
Maruti Suzuki to up exports with new Dzire sedan (06-11-2024)
Maruti Suzuki India is targeting markets like UAE, Saudi Arabia, Chile, Mexico and other Latin American countries with its upcoming new version of compact sedan Dzire to accelerate exports as it eyes over 3 lakh units of overseas shipments this fiscal, a senior company official said on Wednesday. In the domestic market, the company hopes to enhance its share in the sedan market amid the passenger vehicles market shifting towards SUVs (Sports Utility Vehicles), with the new Dzire which is slated for launch next week. “We have been growing (exports) at a rate of about 11.9 per cent in the first seven months of the financial year and we hope to continue on that momentum.
Trump’s Economic Plans Could Worsen Inflation, Economists Say (06-11-2024)
Many Americans fretted about inflation as they headed out to vote. But Donald J. Trump’s approach comes with risks of a renewed boost.
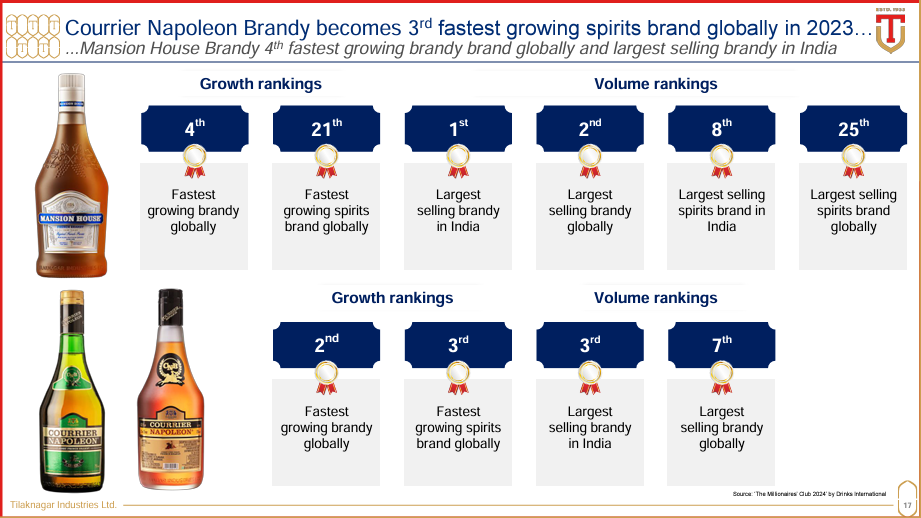
Tilaknagar Industries- Potential Turnaround Candidate (06-11-2024)
Q2 FY2025 Concall Highlights
Financial performance:
![]() Achieved highest ever quarterly EBITDA in Q2 at Rs. 66 crs, YoY growth of 39.1%
Achieved highest ever quarterly EBITDA in Q2 at Rs. 66 crs, YoY growth of 39.1%
![]() EBITDA margin at 17.6%, 422 bps expansion YoY. Industrial Promotion Incentive by Maharashtra, Q1 was 5.56 cr, Q2 was 10.36 cr. Margin Expansion mainly due to cost optimization, premiumization not impacted improvement.
EBITDA margin at 17.6%, 422 bps expansion YoY. Industrial Promotion Incentive by Maharashtra, Q1 was 5.56 cr, Q2 was 10.36 cr. Margin Expansion mainly due to cost optimization, premiumization not impacted improvement.
![]() Profit after tax at Rs. 58 crs, YoY growth of 82%; driven by reduction in finance costs
Profit after tax at Rs. 58 crs, YoY growth of 82%; driven by reduction in finance costs
![]() Net debt free as of September 2024, with net cash Rs. 25 crs.
Net debt free as of September 2024, with net cash Rs. 25 crs.
Guidance:
12 to 15% volume guidance on steady state basis.
Andhra Pradesh
AP has significant brandy drinking population.
Degrowth due to policy change.
Expect volume to grow significantly, as TI is leading player in state. 30 lakh cases industry, can be in 2 to 3 years, it can be 40 lakh cases.
AP is currently 30% of sales.
Retail going private makes market consumer driven. It benefits TI as company have good franchise. Industry will increase and company will take bigger pie. 10% shops will increase. Private players will make sure they are stocked, customers are satisfied etc. Expect overall improvement that will help to grow.
Telangana:
Overdue position is now 10 weeks. Normal is 8 to 9 weeks. Highest was 18 to 19 weeks.
IMFL Pricing committee will soon decide pricing.
Total receivable is 130 cr. Overdue is 80 cr.
Karnataka
Reduce duty, increase in volume. MRP goes down have impact positive impact.
Assam & North East:
Assam is very receptive to new product that is why Mansion House Whisky is launched in Assam. It is semi premium segment, comparable brands Royal Stage, Royal Challenge. It is priced at 560 rs. For 750ml bottle. Assam is having large market for this segment.
Upfront investment, working capital is lower compared to others.
Others:
Luxury foray is few week away. It will have incremental margin expansion, which we are not guiding as of now. One more launch after 6 months.
Easing of raw material and packaging cost.
Expect further expansion of margin.
Green Apple Flandy have very good response. It will not be millionaire brand this year. Flavoured spirts is fastest growing category in IMFL.
Tax can be back from Q1 FY2026.
Brandy is more than 90% of sales. Visio is to have 20% from Non Brandy by 2030.
CAPEX:
Maintenance CAPEX of 15 to 20 cr/year.
Distillery CAPEX not yet decided, recommission 100KLPD plant, which will cost 45 cr. If new distillery build it may cost 100 to 120 cr.
Strategic Investments:
Spaceman Spirits Lab Pvt. Ltd., the makers of ‘Samsara Gin’ and ‘Sitara Rum’.
Will start selling their brand in select state and internationally.
FY 2024 Revenue only 20 cr. It can be 100% for next two years.
TI will manufacture and sell in agreed state, where revenue and cost will come to TI books and will pay royalty to Spaceman spirits.
Samsara Gin and Sitara Gin goes along with TI’s luxury brand gives opportunity as alcoholic beverages is distribution driven market.
Round the Cocktails Pvt. Ltd., the makers of ‘Bartisans’, a ‘Ready to Pour’ cocktail mixers brand.
High brand recall, strong unit economics. Company is in non-alcoholic beverages.
80% sale online, they are digital fist company.
Expect significant growth.
It has no restriction on marketing due to non-alcoholic beverages.
There will be collaboration between Bartisans and Tilaknagar Industries.
Incredible spirits: It was small investment at 1cr. Sell this stake at cost in October.
Investor Presentation:
https://www.bseindia.com/xml-data/corpfiling/AttachLive/0f22af78-57a7-40d1-8c67-f926584c0c9c.pdf
Disclosure: Invested
Subex Ltd. – Possible Turnaround? (06-11-2024)
Hey, anyone still tracking or is invested in this stock? One of my close friend recommended this stock to me but i am still hesitant.
Investors richer by Rs 10.47 lakh cr in two days (06-11-2024)
Stock investors have become richer by Rs 10.47 lakh crore in two straight days of gains in markets as benchmark Sensex jumped 2 per cent. At close on Wednesday, the market capitalisation of BSE-listed companies surged by Rs 10,47,565.48 crore to Rs 4,52,58,633.53 crore ($5.37 trillion) in two days of gains. “The feel good factor of Trump’s win in the US election had a rub-off effect on world equity markets, including local indices as domestic investors resorted to value buying, especially in IT stocks, which pushed the benchmark Sensex above the 80k mark.
Voltamp Transformers (06-11-2024)
does anyone have the analysis on the capacity usage of these players vs how much capex, source of funding etc? Pls post even if these are scattered info (not in organised format).