
Through screener’s import data, we can get data of imports by rate ( Price Per KG ) and value.
To get qty, we can simply divide the both and Plot it on a graph to see import volumes trend.
Have done the same for all import categories for MDF, here are the results –
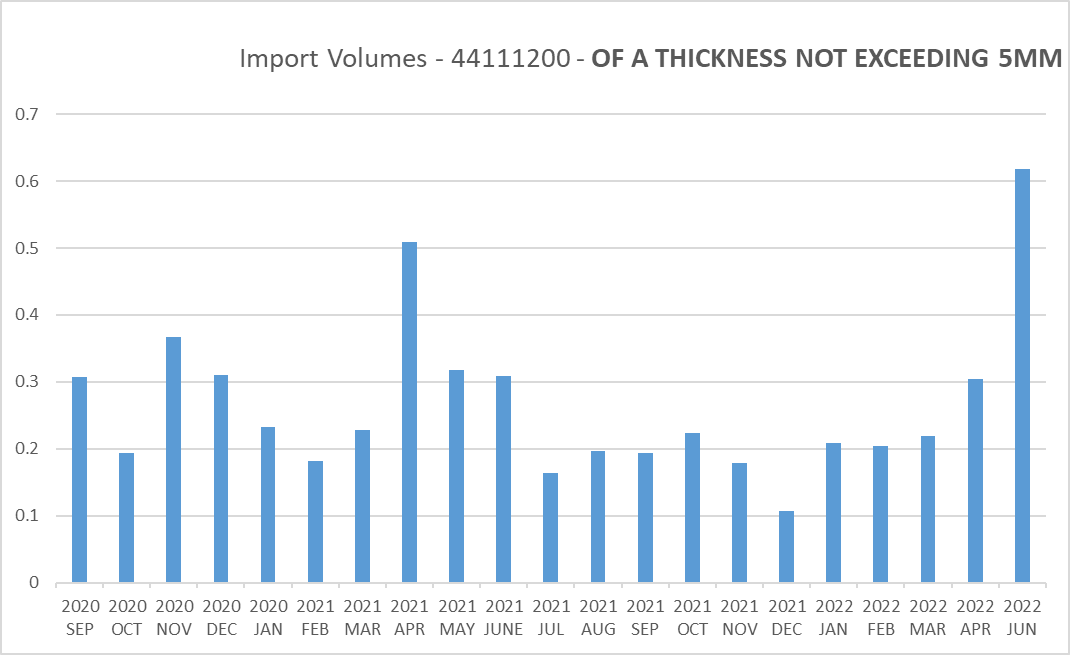

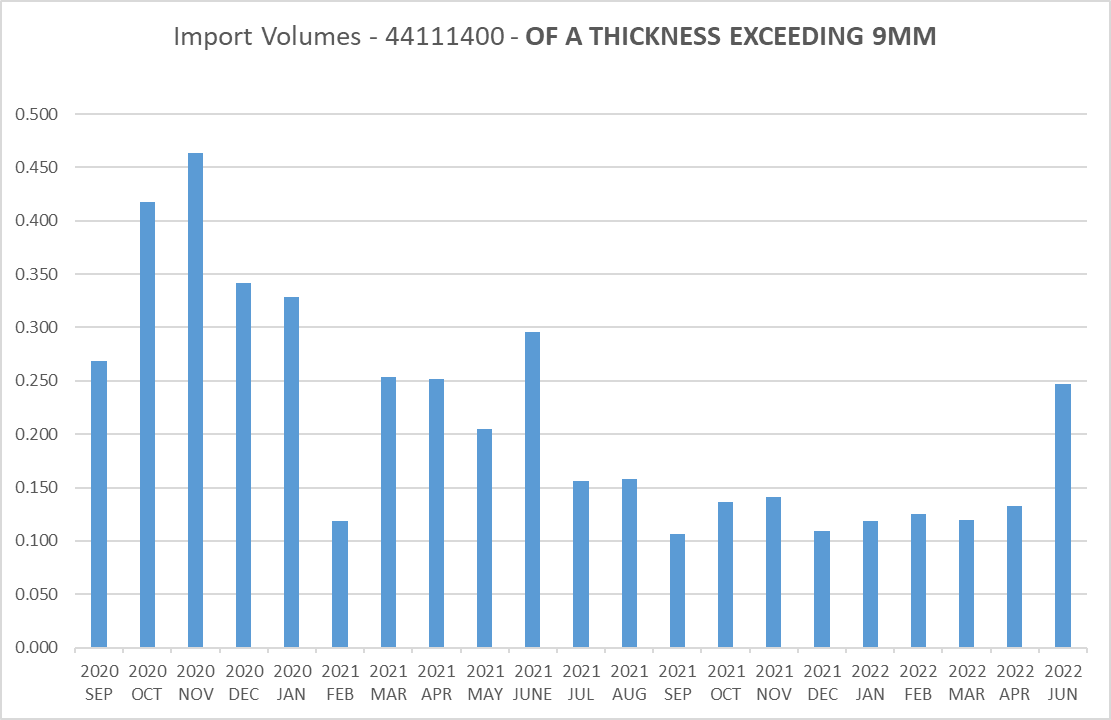
It can be seen that in June 2022, volumes are Picking up as compared to the Previous months so imports are coming back – worrying trends!
The Problem with this indicator is that it’s a lagging indicator and not a leading indicator as data comes 1.5 months late!
| Subscribe To Our Free Newsletter |
