
Happy Independence Day everyone!
RIP to India’s best investor/trader. Our favorite investors’ favorite investor, Rakesh Jhunjhunwala.
As promised, I am doing a dive into Technical Analysis and charts.
Firstly, I should mention some major FAQs –
- Does technical analysis work?
A – Technical Analysis may/may not work in terms of what we define as technical analysis. Identifying random and obscure chart patterns and drawing lines is not technical analysis IMO(an opinion shared by many TAs). TA is a tool to gauge supply and demand and finding points in the market to enter and exit.
- Would it work if people didn’t follow charts?
A – A good exercise for the curious would be too look into the charts of superwinners from pre 1900s. Then the charts from 1900s, all the way to the 2000s and the present times. Breakouts & VCPs(Volatility contraction patterns) are timeless. They work continously and will do so(why explained next), from the times when charts did not exist, all the way to times when people paid attention to charts.
- Why does it work?
A – Fear and demand in humans(en masse, not individual thinking) hasnt changed in 100s of years. We just aren’t built to be purely rational hence inefficiencies exist in the market.
- Okay then what is TA and how to use it profitably?
A – I’m learning too, let’s find out.
What is the technical analysis that I’m talking about
It is important to set our scope of conversation, TA is multi-faceted and varied but what I’m researching will be CANSLIM-esque, momentum, trend following, breakouts and VCP, no intraday as it doesnt benefit me.
Charts: The value proposition
- Aids Fundas – Imagine a scenario I recently found myself in. Reading hundreds of VP threads, running screens on screener, and found a business which will grow at 30%, has operating leverage available 15x net of cash, and on top of it has low float. But then once I loaded up on the position, multiple things in the story changed, growth slowed, margin compressed instead. Made a loss which cut my profits in half.
Fundamentally, I couldve done better, done more research but 1 trick that would help is putting weight to the charts. The stock never made a higher low, and never once came out of a downtrend. The chances of making money were low. Unbeknowsnt to me, there is tons of overhead supply which makes it harder and harder for the stock to come back.
Even legends like Joel Greenblatt(40% for 20 years), Michael Burry(50% in initial years), Jack Dreyfus(of Dreyfys Funds), Stephen Druckenmiller(30% CAGR for 30 Years), George Soros(Macros but still pays attention to charts) have employed charts for investing and trading purposes.
- Standalone. All by themselves charts are better used for shorter term swing trading. But there is a nuance. TA doesnt predict moves in stock prices >50% of the times. It is our job to set profitable risk to reward for ourselves.
All successful technicals forward traders that I found are OBSESSED with the risk they take. Age old Munger wisdom of identifying risks before reward has found its place deep in the heart of successful trading.
Some track records – Kristjan Qullamaggie(270% CAGR for 7 years), Mark Minervini(100%+ plus non-compounded returns for >30 years).
System
Well made system to cancel out excessive risk taking.
1. What I’m looking for
I’m limiting my universe, exclusively to breakouts, VCPs, trend following. Let me show you some examples.
Breakouts
VCPs(structures found pre-breakout)
Tighter and tighter moves to the center. range keeps decreasing. Higher chance of breakout. Happens on consolidation of an uptrend. When volume falls a lot during the consolidation of an uptrend. The volume reduces the company to under 50DMA . The companies tighter range, has generally pullback lesser and lesser.
- Volume should dry up at the lowest levels of the base
- With each contraction price gets tighter and volume lowers
- If the price doesnt taper it means supply is still coming to the market, put buying on hold
- Stock must be in a prior uptrend. up 30-40%
Needs some days at under pivot point so that supply is absorbed, requires very tight preferably under 10% final contraction. Wide and loose is never good.
Supply & Demand
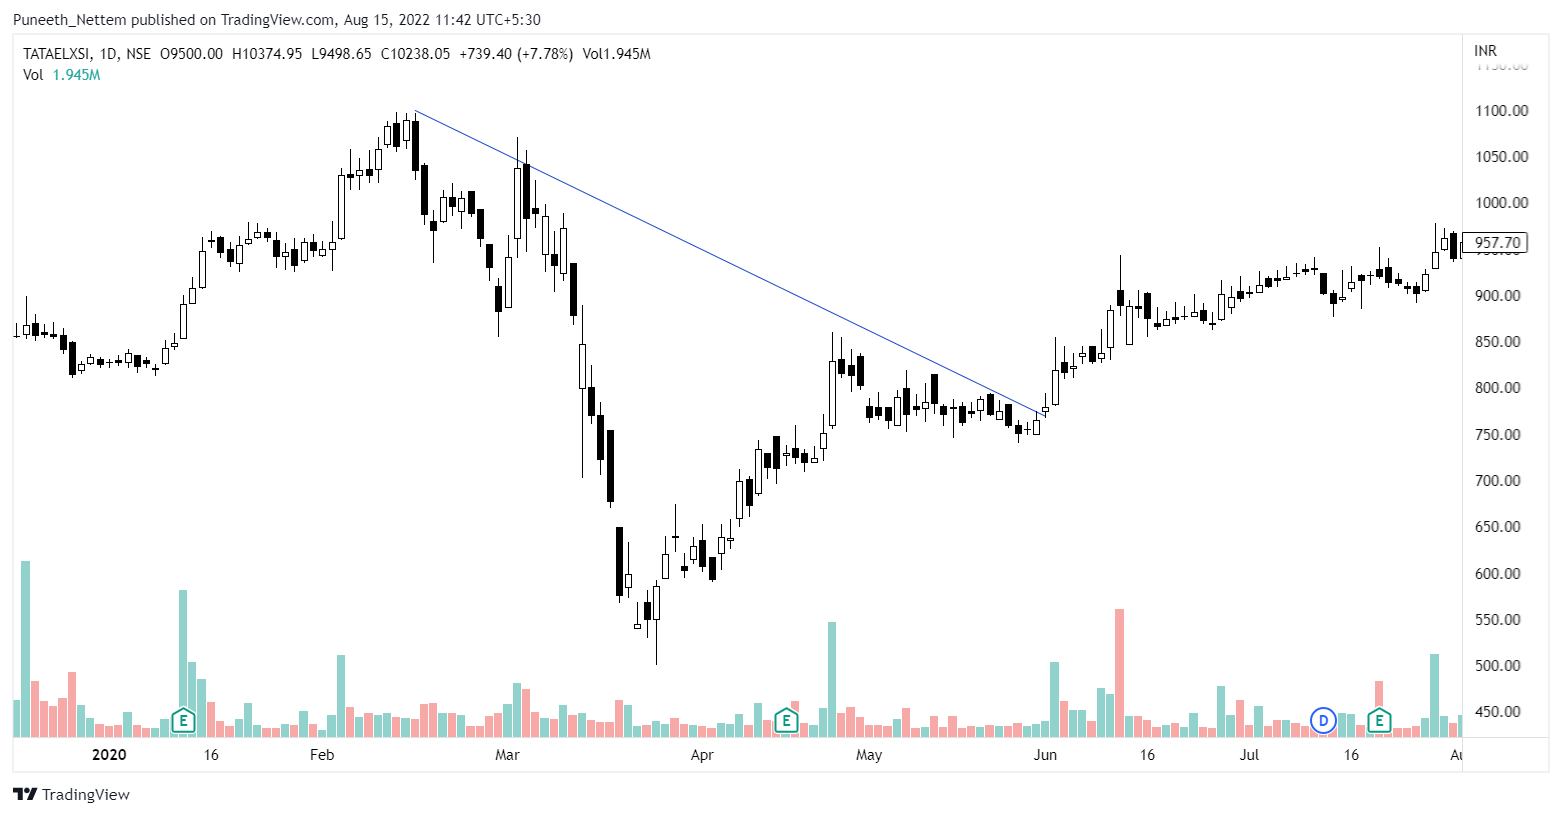
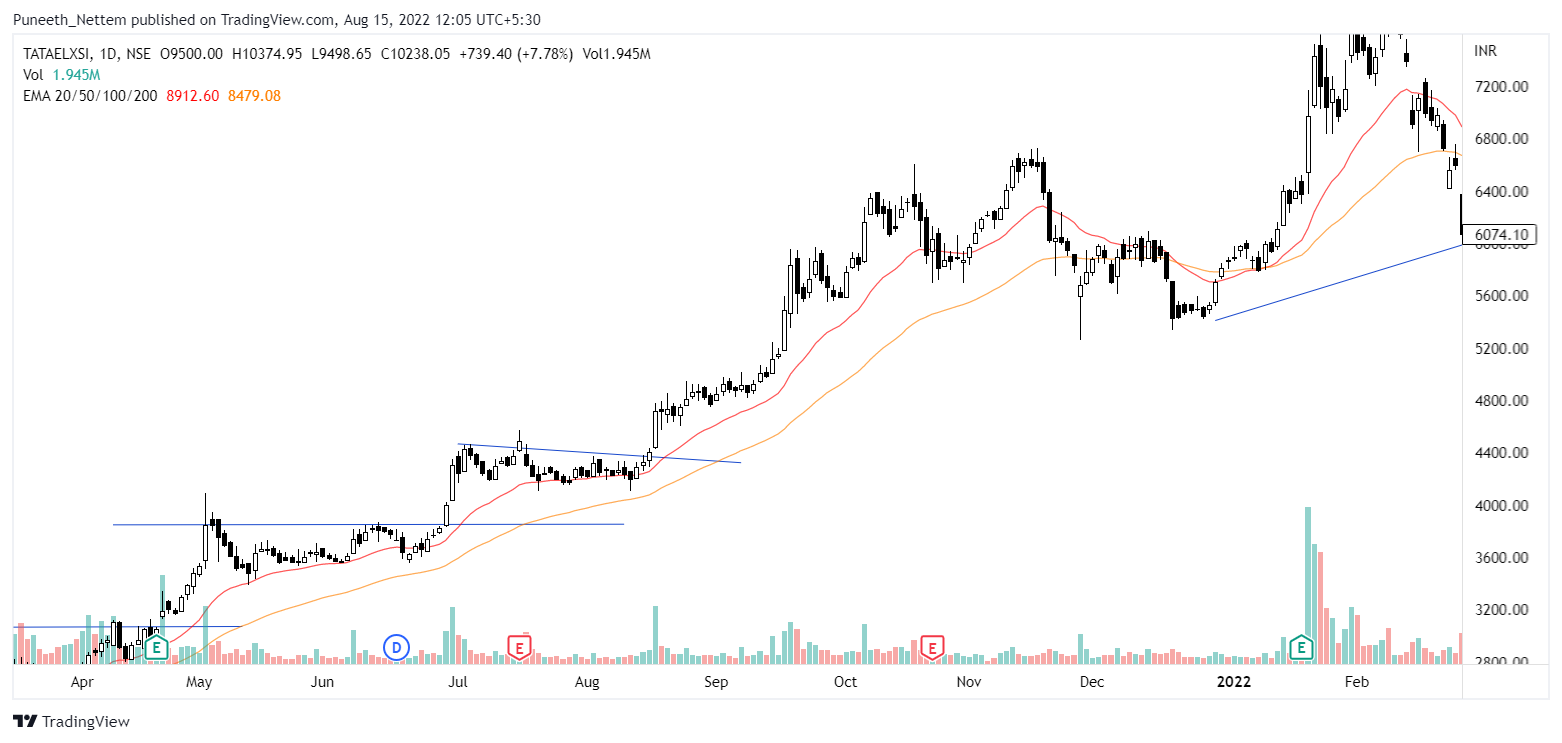
Let me explain this beautiful little concept(within the confines of charts in equity markets) with the help of this years big winner, Tata Elxsi.
Covid time breakout from lower lows formation. At this point a large number of holders(weaker hands) sold out in covid crash and now supply coming to markets becomes lesser. Notice the days in may where the price is tight and volumes are very low. This is an indication of low selling pressure. Hands are stronger here.
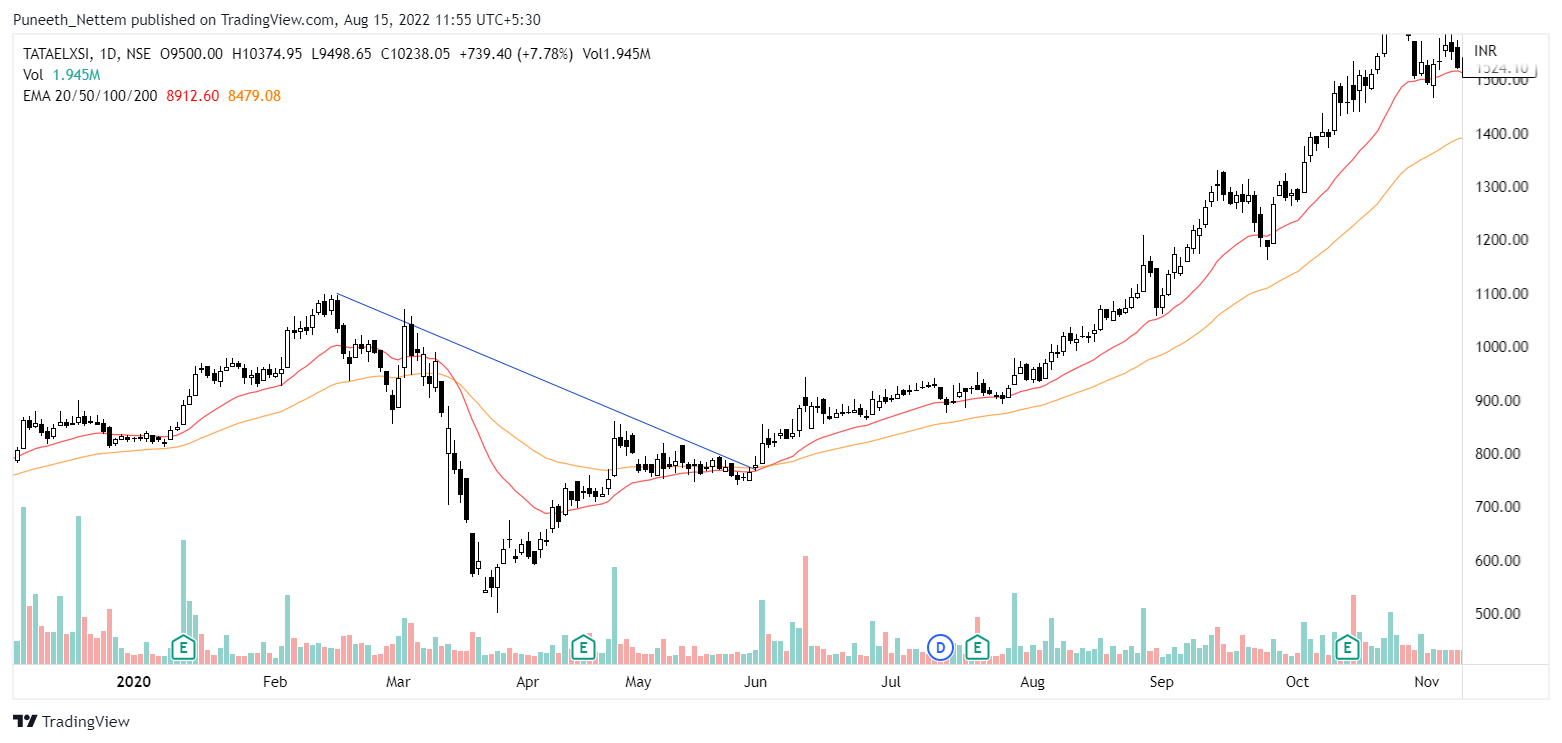
What follows is a good move without ever breaking 50 DMA(yellow line) not even once, the stock glides over the MAs peacefully, every time it touches 20DMA(Red line) is a buying opportunity. Any breaking down of 50 DMA(day close below 50 dma) can be set as trailing stoploss.
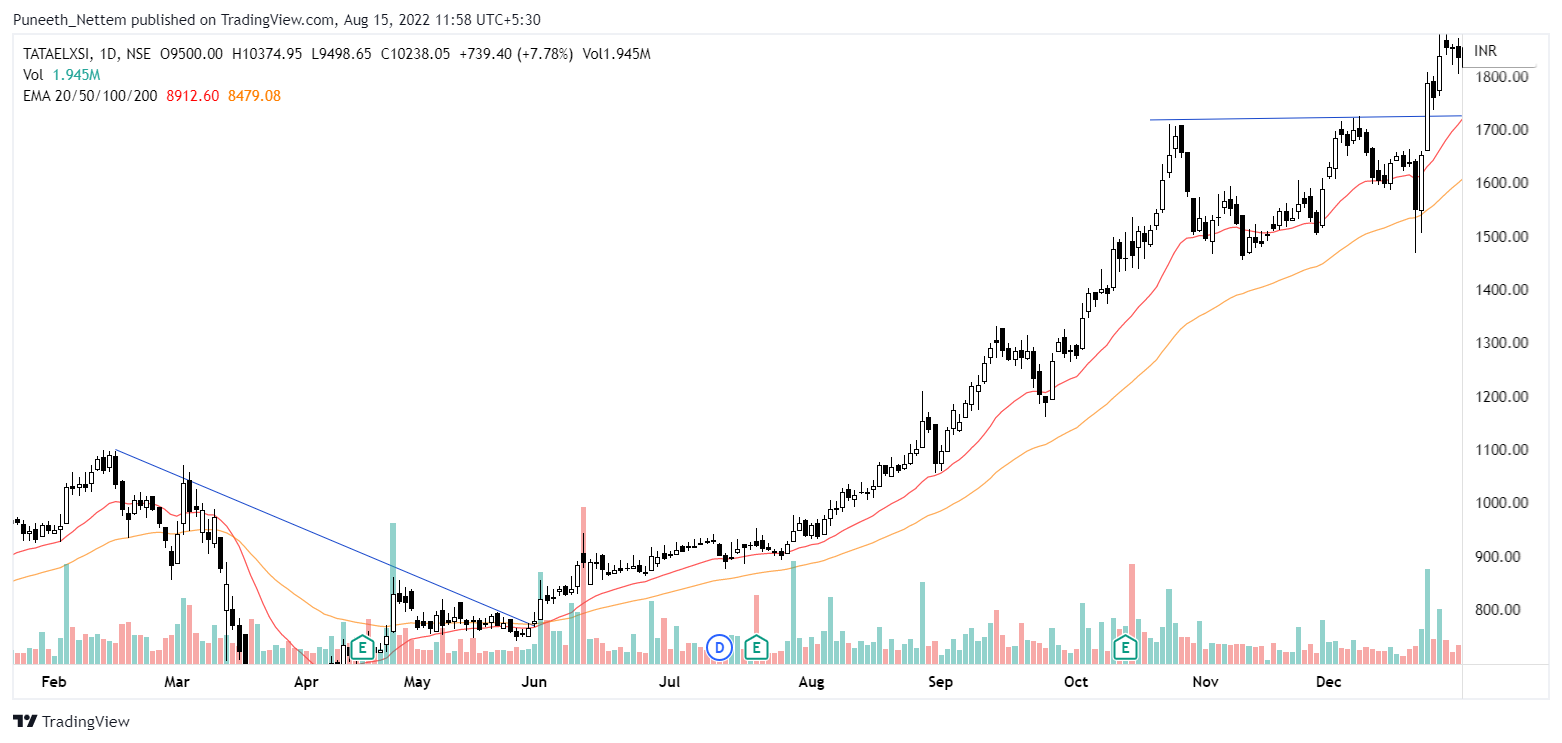
Stock consolidates and forms a base. This is where people book their profits collectively. Track the charts and as it respects the MAs and creates a base with lesser volumes and notice all selling days come with low volumes. Signals Strength.
Stock advances. Again notice that Green days are accompanied with high volume and red days with low volume. Another stopping point to let inbvestors sell out, respects 50 DMA and volume tightens, set for another breakout.
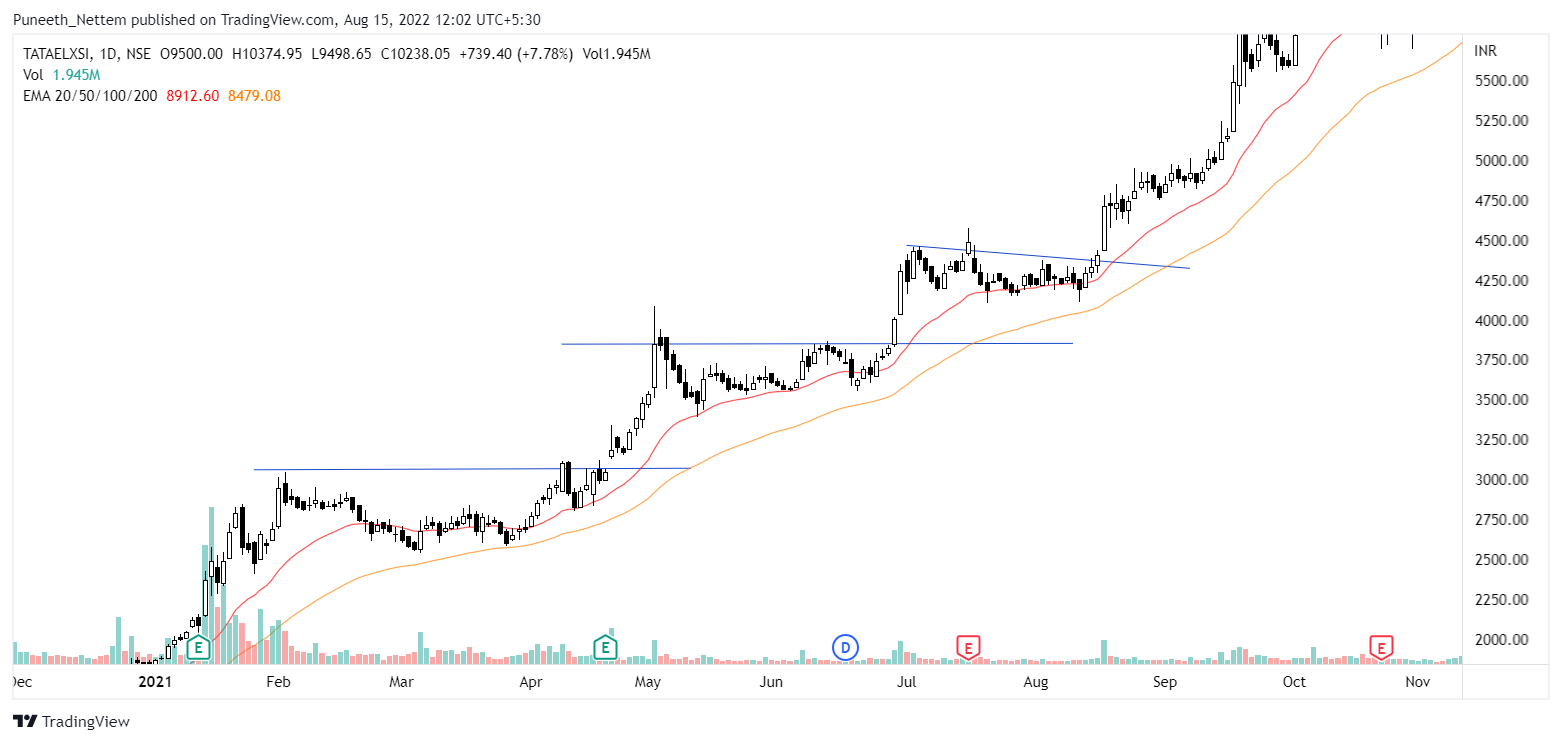
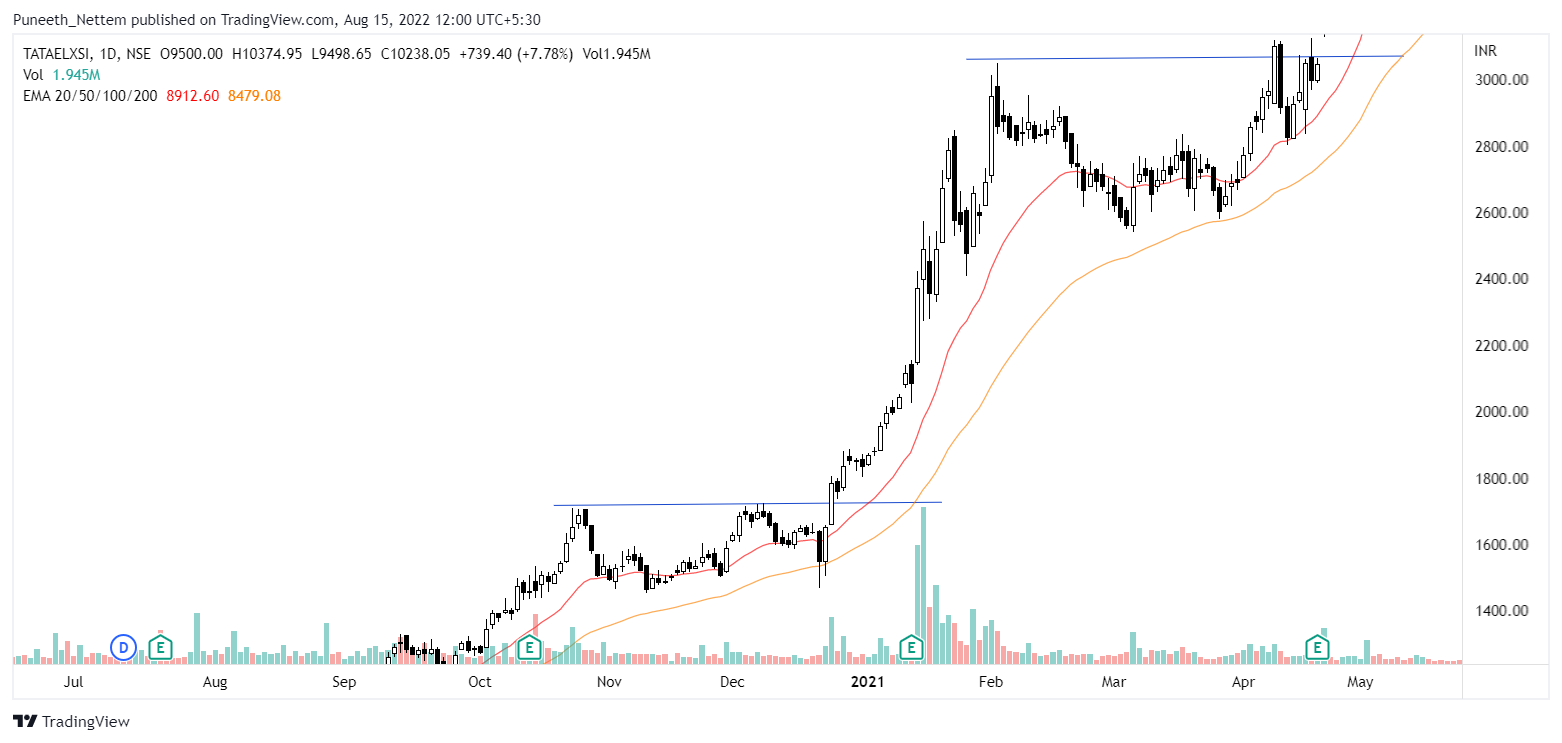
Stock advances and makes a series of bases upon bases, all while respecting our trailing SL at 50 DMA. At this point many investors sold out due to expensiveness(I passed on it myself, and yet it outperformed every stock I own after I thought upside was limited due to sky high valuations). Each base has low volumes and every breakout has high volumes. Signals strength(see how institutional demand works out?)
Here you get stopped out leaving you with nice gains. But wait, after selling it, add this stock to watchlist and watch its moves.
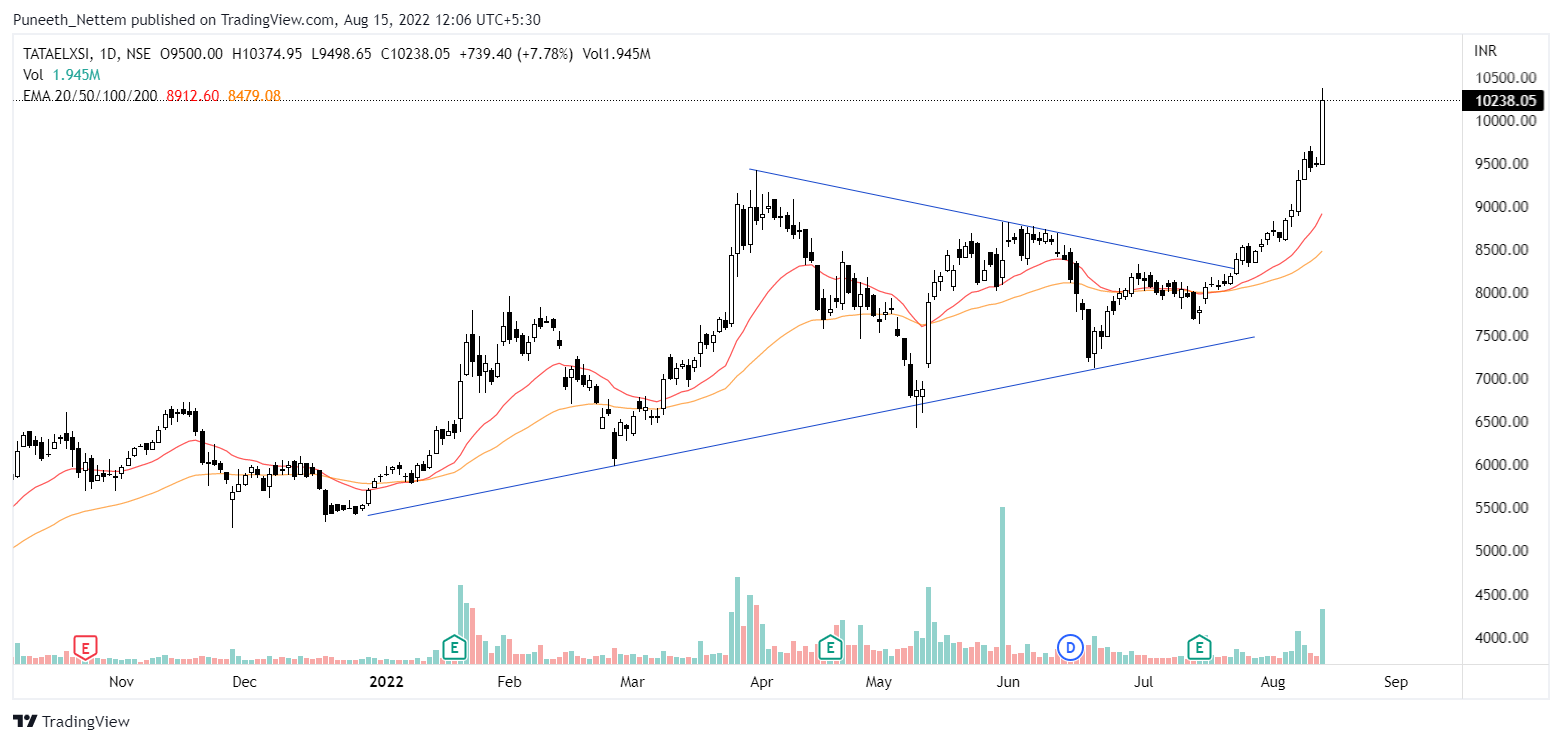
Watch its moves you can see another basing, at a much higher price of 8500, you buy the breakout again without price anchoring yoursef. Again notice small and low volume reds and larger green days.
Don’t stop at Tata elxsi, examine every winner you know, Saregama, Navin, Pitti, RACL, Elecon etc. Dont stop for covid bull markets, go back decades, go past countries, the patterns are countless and the experience priceless. Examine 1000s of winner stocks, and the same things repeat again & again.
A list of characteristics that I’ve compiled on breakouts after examining Indian winners.(The following took a long time to put together)
- A prior uptrend.
- Strong parent company
- Multiple bases and entry points
- Recent IPOs
- Part of the winning industry group
- Low-float
- Strong Funda-story
- Increasing promoter buying
- Increasing MF buying
- Low retail holding.
- Breakouts with high volumes
- Volume contracts.
- Strong earnings growth
- Trend never breaks
- Respects 50 DMA
- Usually double bottom(if reversal)
- Many shakeout candles(with very long wicks)
- Large volume for green and vice versa
- Usually a well made base makes for stronger moves
- Pivot entries(where Stoploss can be <3%)
- Expensive gets expensiver.
2. How I track them
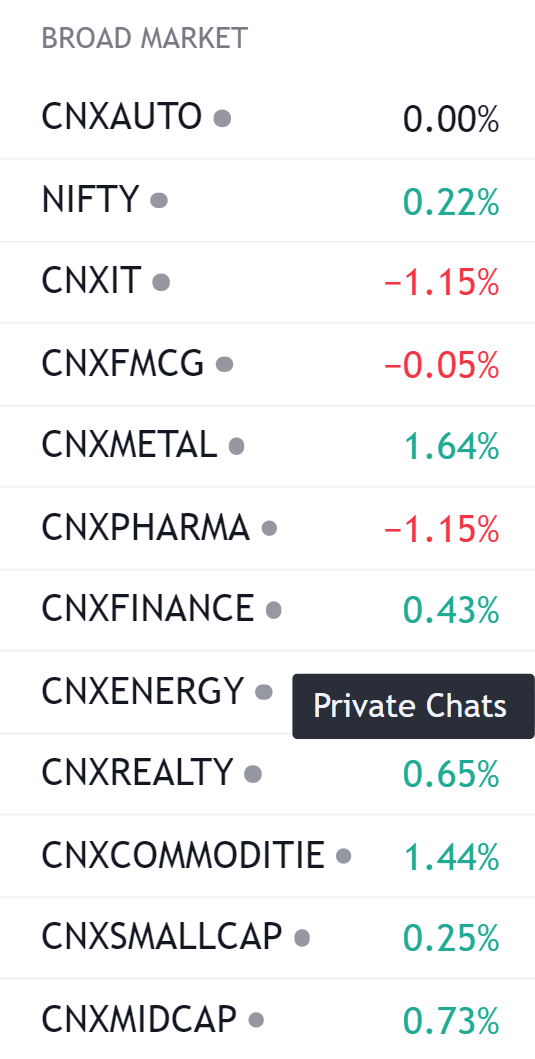
I screen through Marketsmith India, Industry groups which look interesting(found autos, paper, and cinemas, capital goods interesting), and follow thematic indices on Tradingview. I keep watchlists where I add interesting stocks and track them as the come close to breakout.
3. How I buy and make SLs
Currently a work in progress as far as execution goes. I’m looking into keeping risk under 5% for most trades. Once I have a system set in stone, I will share.
Current Watchlist.(Will edit and add some more with charts in a while)
- Fluorochem(been watching since I sold and gave double the returns after my sale)
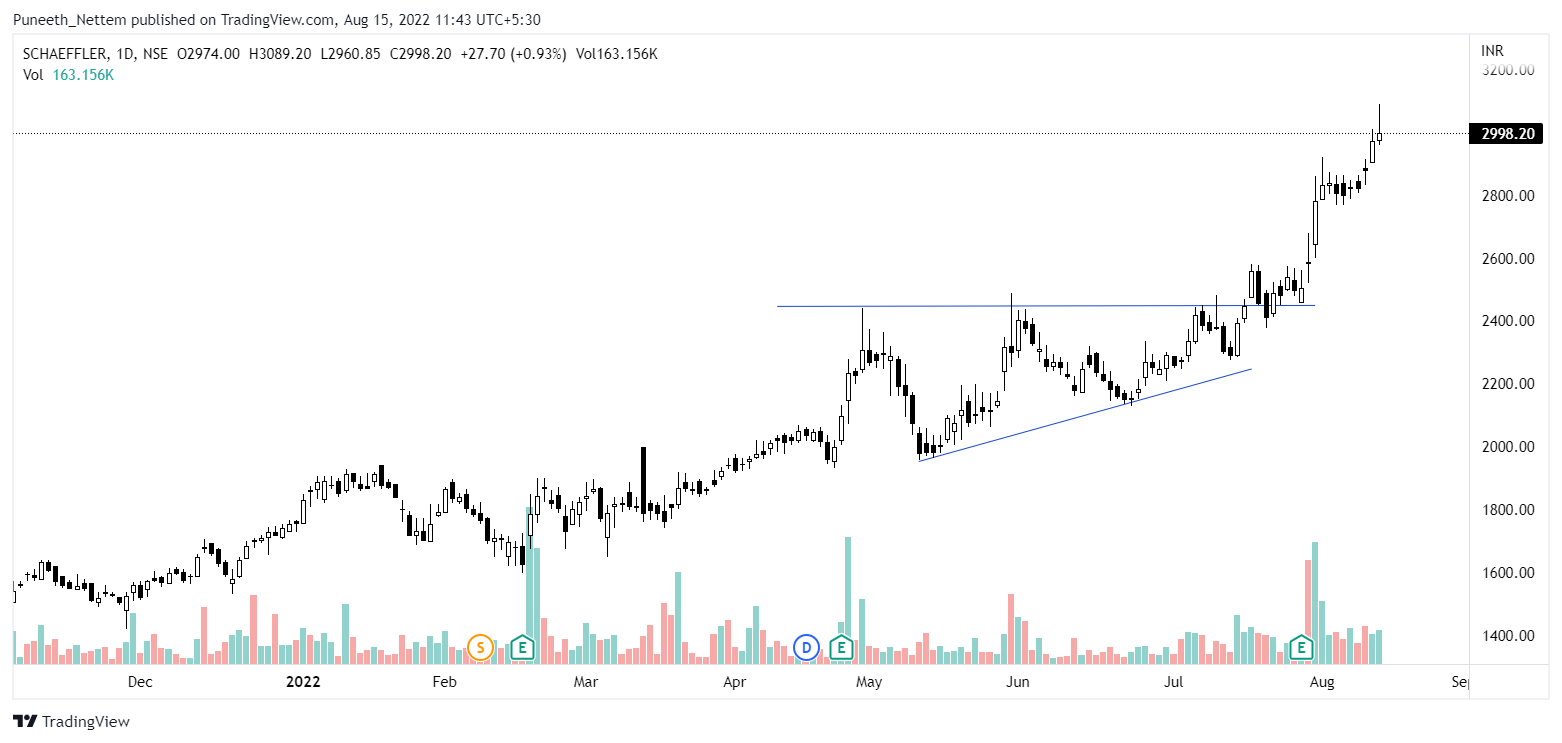
- Schaeffler
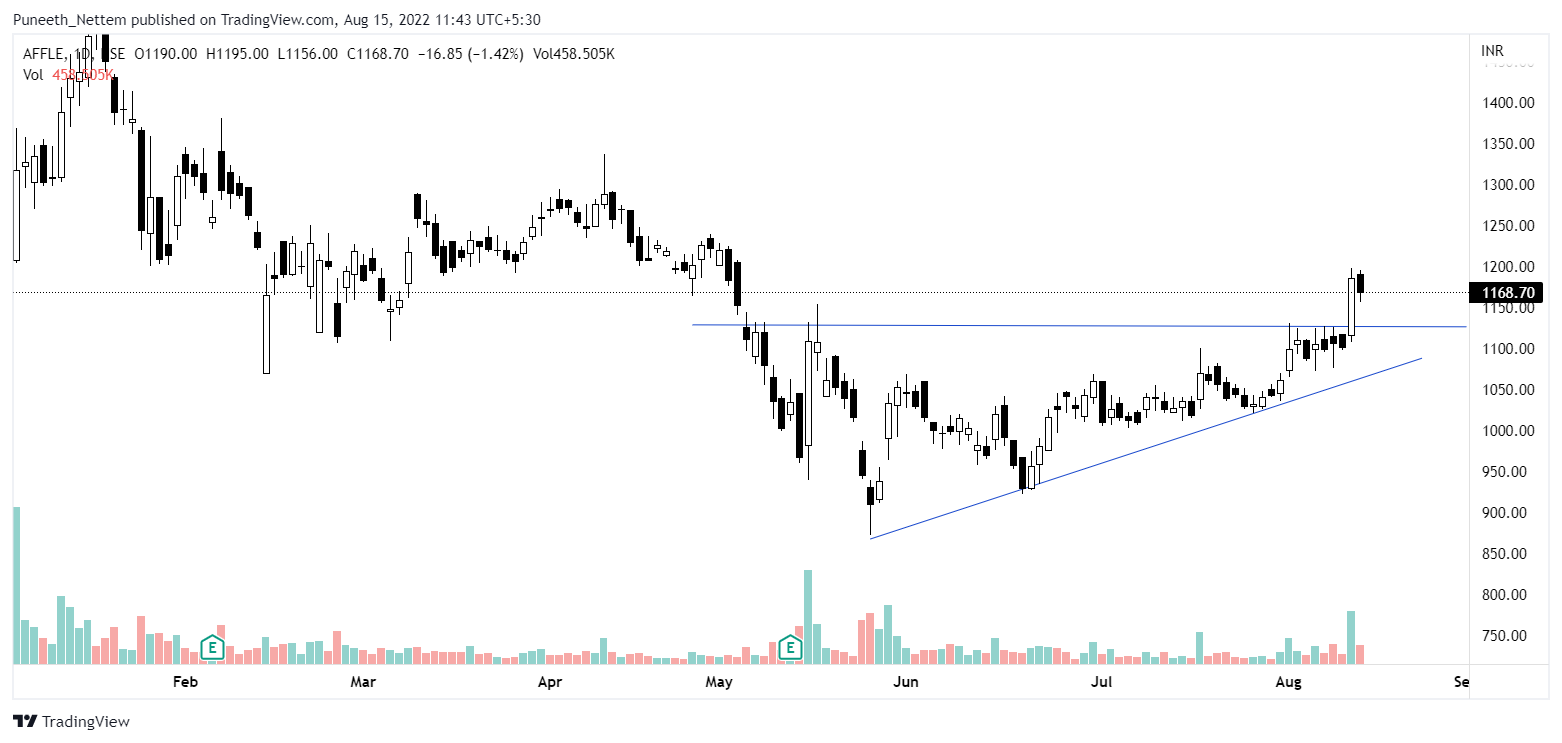
- Affle
- Manyavar
- Homefirst
- Hariom Pipes
- SBCL(a bit extended)
| Subscribe To Our Free Newsletter |
