
Compared import values for the 3 segments of MDF for 3 periods – Last 4Qs (Q2 FY22 to Q1 FY23), corresponding year-ago Qs (Q2 FY21 to Q1 FY22) and corresponding quarters from 2019-20 (pre-pandemic). The story in charts looks something like this
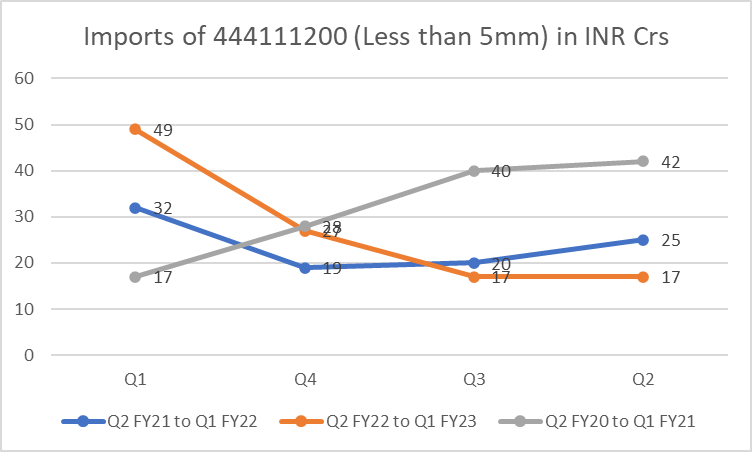
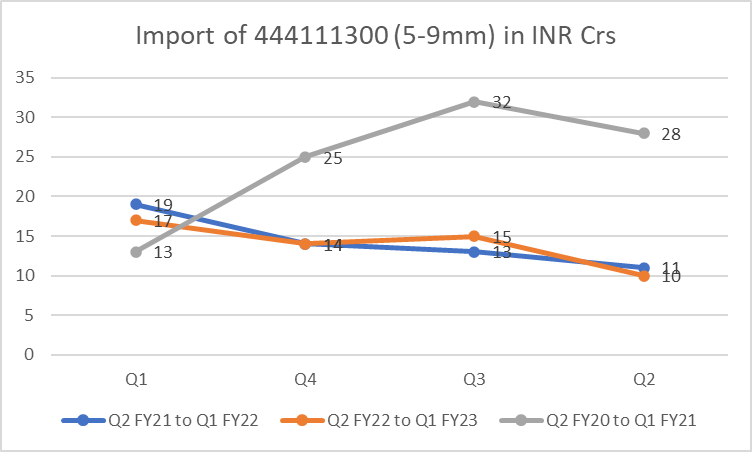
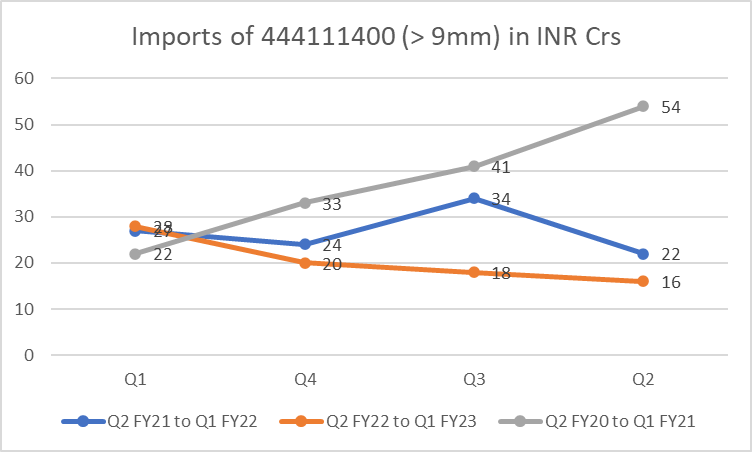
The import trends for all 3 segments are increasing in the last 4Qs as evident from the graphs. But its clearly visible that the highest increase has been in the < 5mm low realization category whereas import volumes haven’t increased much in the higher realization 5-9mm and > 9mm categories. I would interpret that as good news as long as this trend holds.
The overall Q1FY23 import value is ~94 Cr which should be around 10-12% of total Q1FY23 MDF sale in India. On a rolling 4Q basis, the total imports of around ~250Cr should amount to ~10% of total domestic sales in the rolling 4Q. If you compare this with FY20, total imports of the 3 categories of MDF were around 460Cr which amounted to almost 30-35% of domestic sales in that period.
So the current imports are still way less than peak imports and even though they are trending up in the recent 4Qs, the numbers and proportions seem to be well under control to cause any immediate pricing pressure in the domestic market. However, close monitoring is warranted for sudden spurts.
| Subscribe To Our Free Newsletter |
