
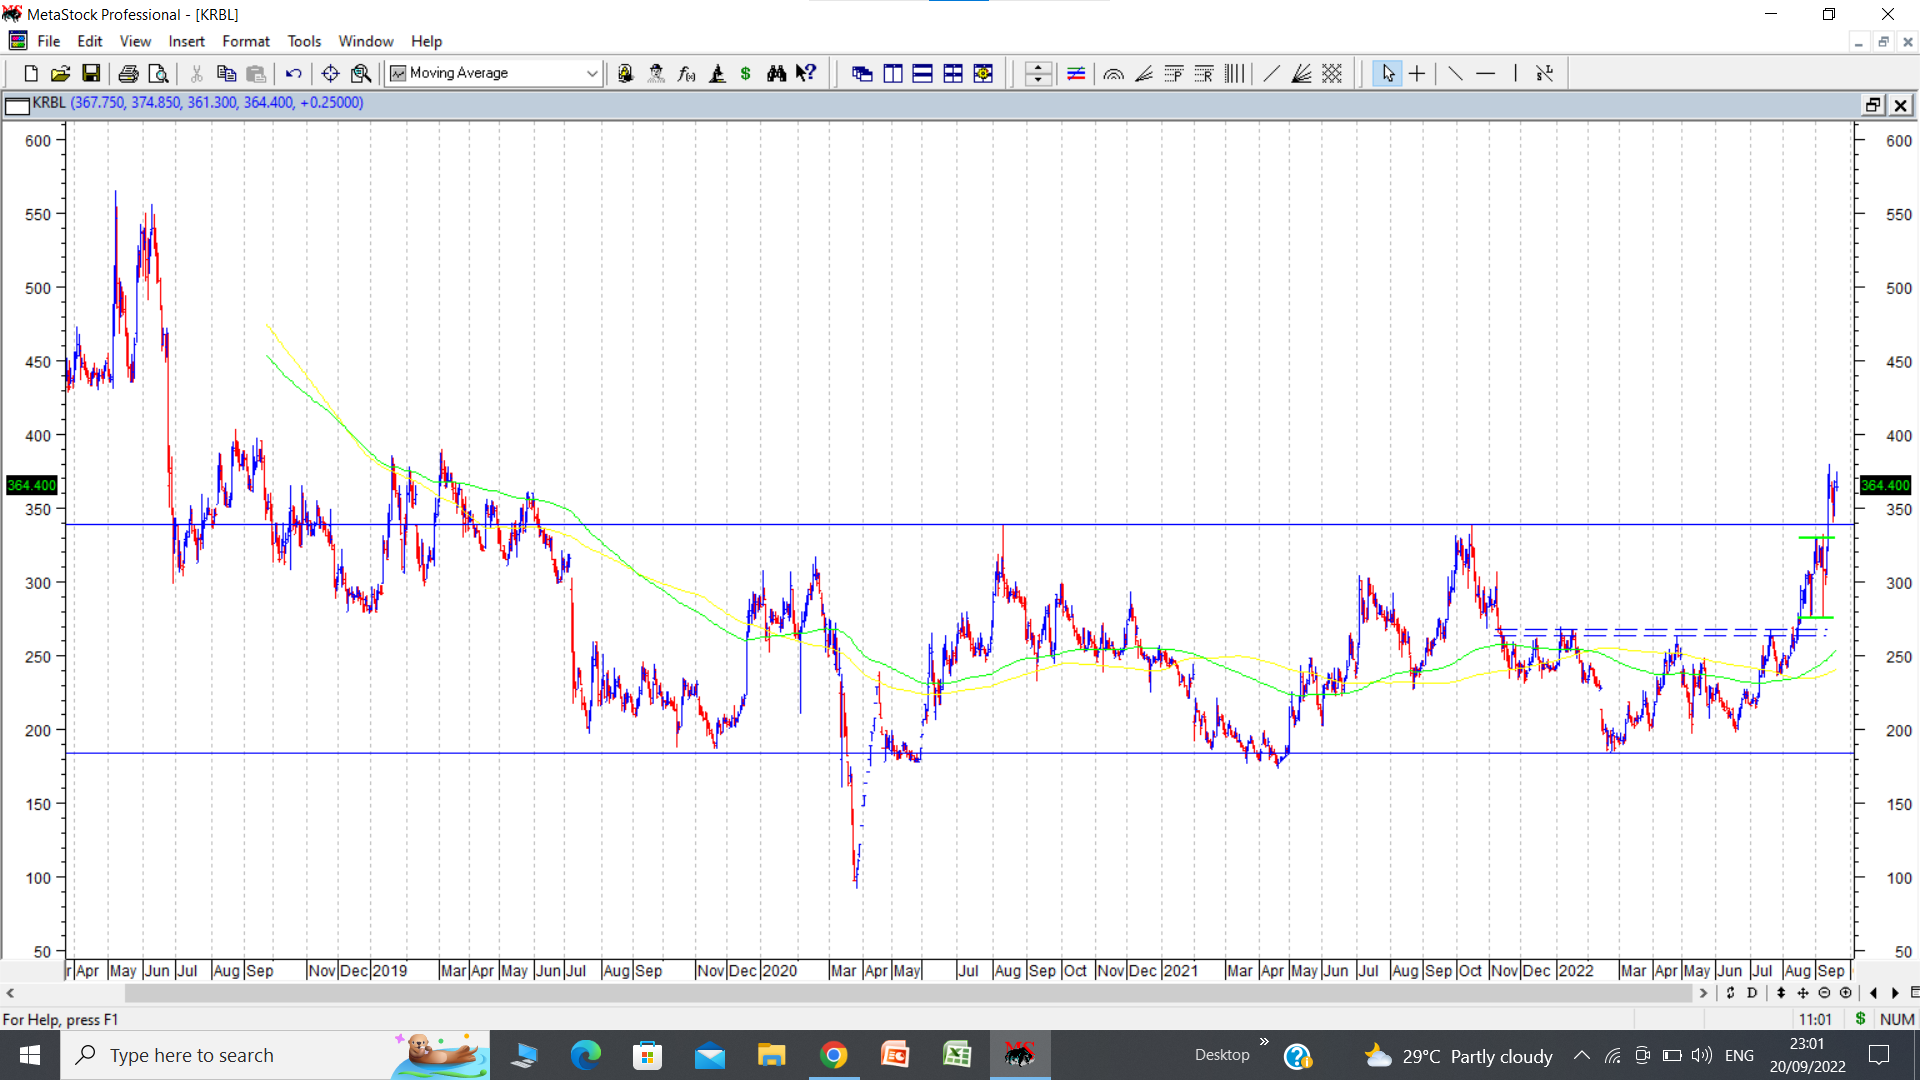
KRBL stock price has crossed an important resistance zone of 340 which was also its 3 year high level. There were strong volumes when stock price crossed this level recently. Posting below the chart of KRBL.
The upper horizontal blue line represents a 3 year high resistance line at 340.
Soild green thick lines represent a double bottom formed (consolidation before attempting 3 year high) between 276 to 330, wherein it spent nearly 17 trading sessions before breakout on the upside.
Two dotted blue lines represent an early stage breakout above strong resistance zone of 263-268, where one could have attempted to pick the stock early.
The range of the horizontal consolidation (barring a short shakeout kind of dip to 92 in the sharp March 2020 correction) was from 180 to 340, which is 160 Rs. Adding this 160 to the breakout level of 340 gives us a working target of 500 which we can keep at the back of our mind.
Fundamentally Pakistan which was a major exporter of basmati rice has suffered severe floods leading to disruption of supply and thus opens up more space for lucrative export markets of middle east and Iran etc for players like KRBL.
disc: invested as a techno funda bet recently post breakout.
| Subscribe To Our Free Newsletter |
