
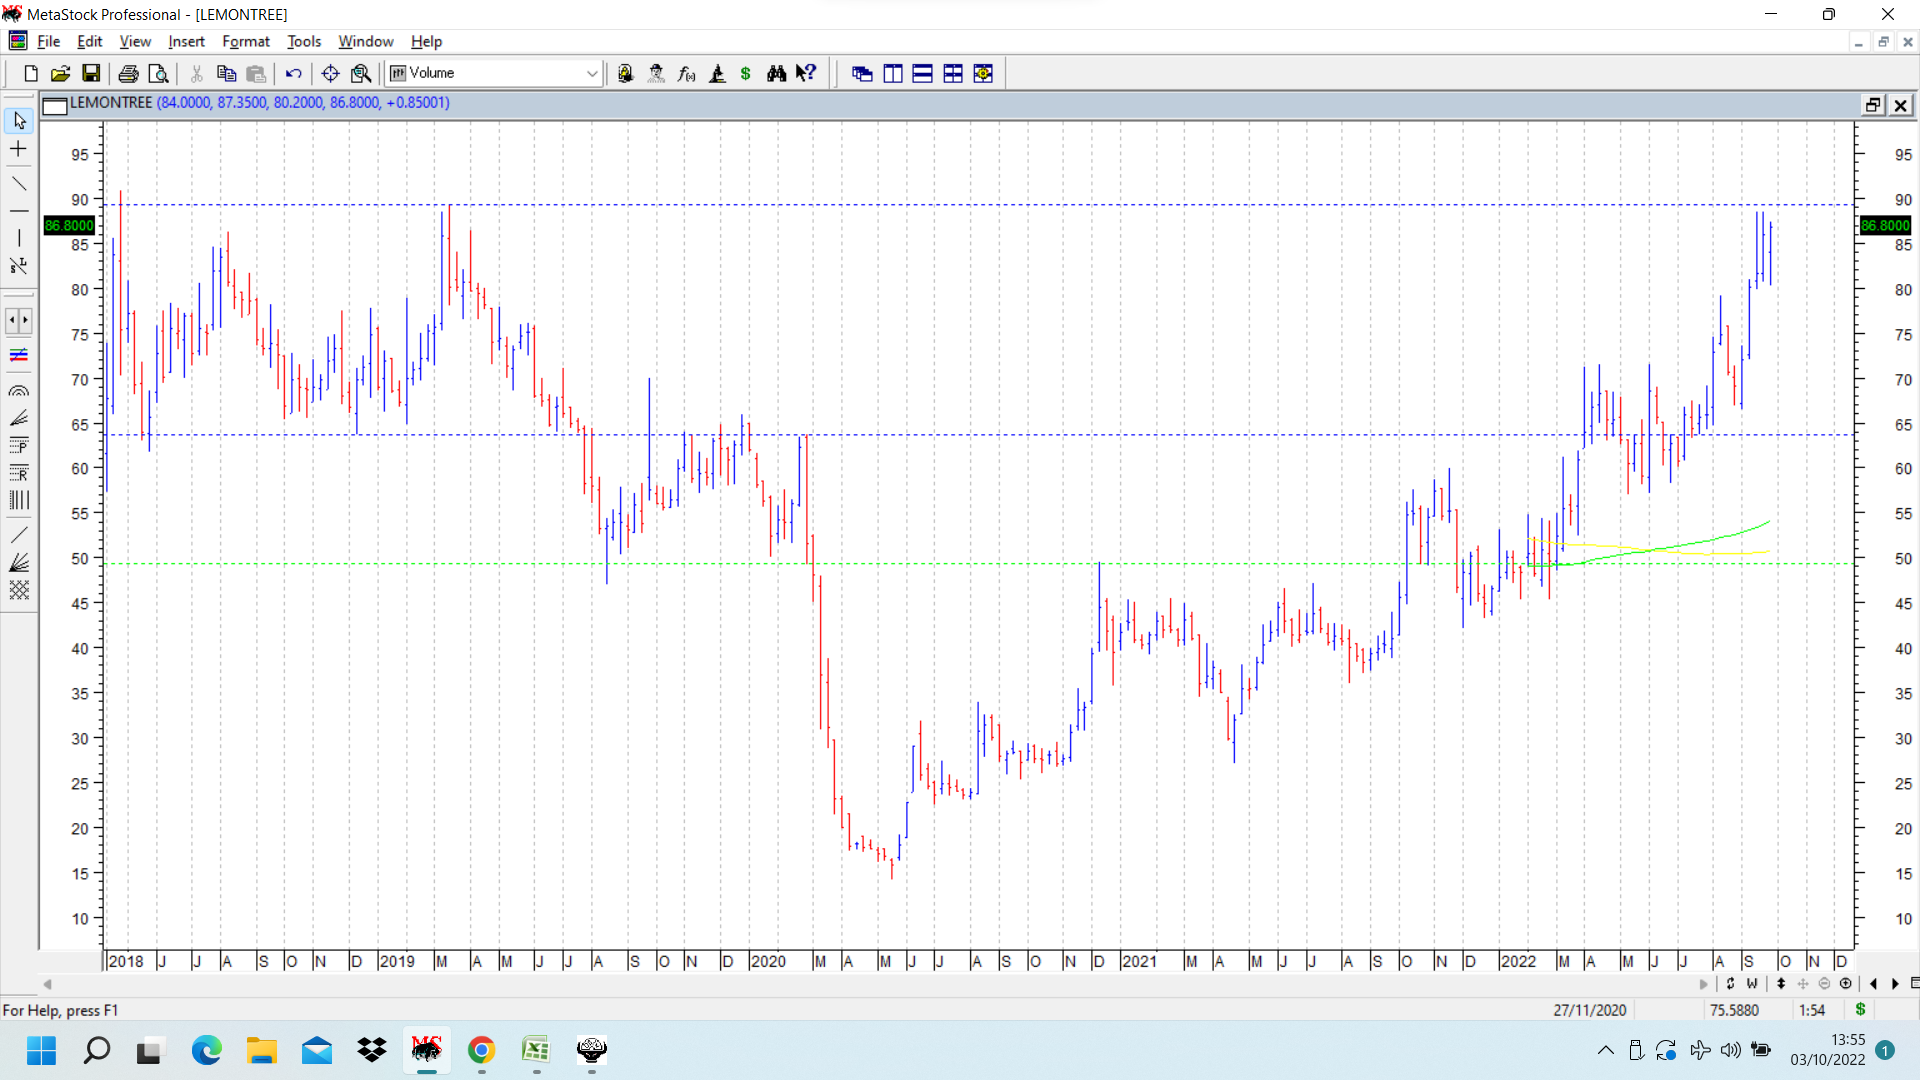
Lemontree charts have been posted in the past on this thread and updated. Today it crossed the recent swing high of 88.50 and posted an intraday high (till now) of 90. Previous all time high was also very close at 90.90 immediately post listing in april 2018.
On the left side of chart, we can see a lot of consolidation between 63-90 which took place between April 2018 to July 2019, (marked in dotted blue line) after which the stock price broke down and posted a Covid low of 15. Recently this zone of consolidation I mentioned of 63-90 has been offering resistance to any strong upmoves.
Most interesting thing about this stock’s chart has been that Nifty entered a longish correction ever since Oct 2021 and Lemontree has been in a consistent uptrend since Oct 21. It broke out of a cup and handle pattern in Oct 21. (neckline marked in dotted green line. ) In fact it has made consistent higher highs and higher lows on weekly chart posted below. Other hotel stocks too have run a lot.
Above 90-91, the stock price will post all time highs and enter into free zone, and can go up without facing significant resistance from any stuck positions. I have my fingers crossed to see how this stock moves once it goes past strong resistance, whether there is any parabolic move or steady upmove, or failure.
This looks like an example of a stock going against overall market trend. Mark Minervini frequently discusses these kinds of stocks in his videos and books.
disc: invested as disclosed before.
| Subscribe To Our Free Newsletter |
