
Please see our view on the said stocks :
Here are simple steps to check the stage ![]()
A) Go to weekly chart
B) Apply 10 EMA and 30 EMA
C) If stock is trading below 30 WMA, it is in S4 . Close the chart and go to next stock
D) If stock is trading above 30 WMA and 10 WMA is above 30 WMA,this stocks needs further work
E) See whether it is trading in a range , going up and down 10 and 30 WMA.
F) If it is moving in this trading range, wait for the stock to break out the trading range to make an entry
E) Keep in mind that in most of the times the prices come back to trading range level -to retest. So one can make a small position at the time of breakout and add more after it comes back for retest and starts moving up again. If stock goes below the trading range and 30 WMA , exit the initial position also
F) Many a times there are lot of resitances on left side, so one needs to make staggered entry, ie once the stock closes above those resistances.
G) Keep in consideration that these are weekly charts. So one needs to check closing only on weekend. Many a times stock break up above the trading zone with-in the week but comes back below the range at the end of the week.
H) Every breakout should have good volumes . Any break out with low volume can be a fake breakout.
H) This method works well in bull-markets. In bear markets like these days, you would get lot of false breakout and you might loose trust in the method.
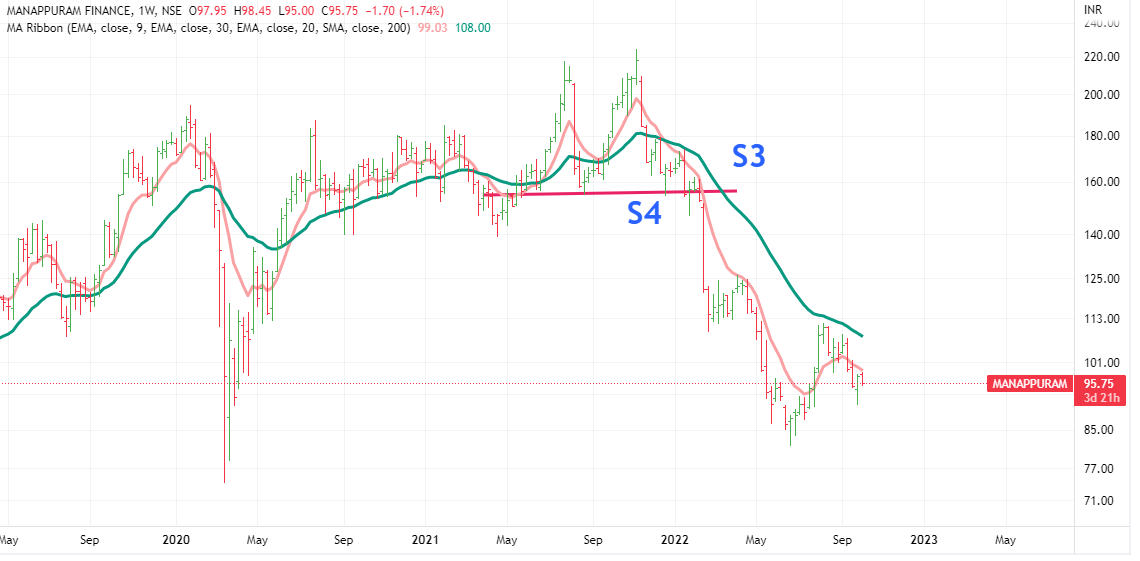
Manappuram
It is well below 30 WMA.No nearby trading range is visible. So no need to pay any attention.
Exit time was when it broke 30 WMA and trading range. One could have exited partially at break of 30 WMA and fully after it broke the trading range.
KMC
Well this seems to be in S3 , in a trading range. But lot of resitances on left hand side. So if it moves , the movement would be full of obstacles.
One should build positions slowly slowly, 1st after the breakout above trading range, then when it comes to retest and does stay back into the trading range for more than a week. More stocks can be added after it keeps crossing and closing above the left side resistances (as shown in the chart)

Disclaimer :We are just explaining the method. No advise or recommendations from our side. And as per our view , we’re in a troubled market, any new position building is full of risk.
Hope this is helpful to understand Stage Analysis.
| Subscribe To Our Free Newsletter |
