
In the previous two article on Index Investing we had seen the returns of the Nifty50 TRI, Nifty Nxt50 TRI, Nixty100 TRI and the Nifty500 TRI over ROLLING 5 year, 7 year and 10 year periods
Hence, in this post I will cover how the Midcap Indices (TRI) namely the Midcap50, Midcap100 & Midcap150 have performed as well as compare their performance with the Nifty50. I will cover the Smallcap indices in another post
The key takeaways from the analysis below are that: The Midcap 150 is the best performing amongst all the indices. The larger the number of stocks in these indices, the better they perform and thus the Midcap 150 > Midcap 100 > Midcap 50. The Midcap 150 has also outperformed the Nxt50 (the star of the previous analysis) but not by that much.
METHODOLOGY
The same methodology used in the previous sections applies here. However, the data starts from April 2005 (instead of January 2003 for the Nifty TRI Indices). This is because the common earliest starting point for all the Midcap and Smallcap TRI Indices is April 2005 as per the NSE website.
RESULTS
GENERAL CHART

The above chart shows the performance of all the TRI indexes starting from 29th April 2005 until 30th August 2022. As you can see the Midcap100 and Midcap150 have outperformed the Nifty50 while the Midcap 50 has underperformed. However, the Midcap150 has performed the best. If someone invested Rs 100 in April 2005 in these indices and withdrew the money in August 2022 then:
- Rs 100 in Midcap150 became Rs 1509.2 (CAGR 16.9%)
- Rs 100 in Midcap100 became Rs 1374.5 (CAGR 16.3%)
- Rs 100 in Nifty Nxt50 became Rs 1335.4 (CAGR 16.1%)
- Rs 100 in Nifty 50 became Rs 1164.2 (CAGR 15.2%)
- Rs 100 in Midcap50 became Rs 846.5 (CAGR 13.1%)
Interestingly, the Midcap150 also outperformed the star of the previous section – the Nifty Nxt50. The above chart shows the return profile of only someone who invested in April 2005 and exited in August 2022. It does not give a CLEAR picture of returns for someone invested between these periods and/or for varying periods of time. It is for this reason we need to see the returns for rolling 5 year/7 year/10 year periods starting from April 2005
EXCESS RETURNS OVER NIFTY50
5 YEAR PERIODS

As stated earlier, we get 149 Five Year Periods starting from April 2010 until August 2022. Some basic commentary on the above charts:
Midcap 50: While the average excess return is -0.5%, it is not a meaningful number because there is a wide variation in excess returns (Std Dev: 5.3%) and also a very wide range (23.7%). This index had excess returns (over Nifty50) in 44% of the periods.
Midcap 100 The average excess return is 2.3%. The variation (Std Dev 5.0%) and range (20.6%) is lower than the Midcap50 but it is still quite high. This index had excess returns in 70% of the periods.
Midcap 150: The average excess return is 3.7% but as you can see there is a still high variation in returns (Std Dev 4.8%) and a high range (18.9%). However, the variation is more on the positive side. The index had excess returns in 76% of the periods. Interestingly, since March-2019, this index is underperforming the Nifty50.
7 YEAR PERIODS
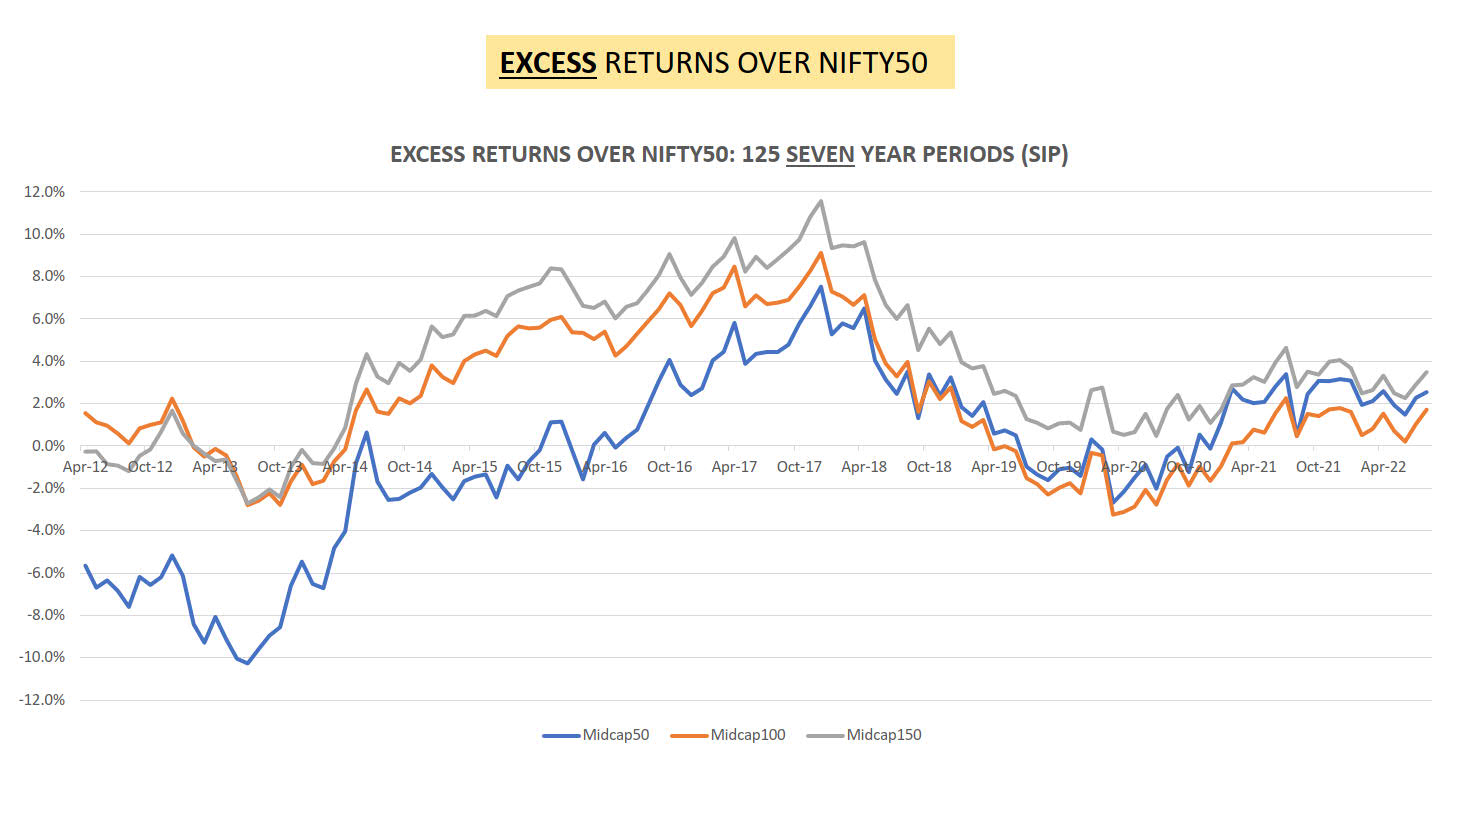
We get 125 Seven Year Periods starting from April 2010 until August 2022. Some basic commentary on the above charts:
Midcap 50: The average excess return is -0.4%. Just like the 5 year periods, the variation (Std Dev 4.1%) and range (17.8%) is the highest amongst the three indices and it is the worst performing. It had excess returns in only 51% of the periods.
Midcap 100: At the outset you can see that this index closely mirrors the Midcap 150. However, the average return (2.1%) is lesser and it had excess returns in only 70% of the periods. The variation (Std Dev: 3.2%) and range (12.4%) is lesser than the Midcap 50
Midcap 150: This index had average return of 3.9% and while the variation (Std Dev: 3.4%) and range (14.3%) is more than the Midcap100, it is more on the positive side. It had excess returns in 84% of the periods
10 YEAR PERIODS
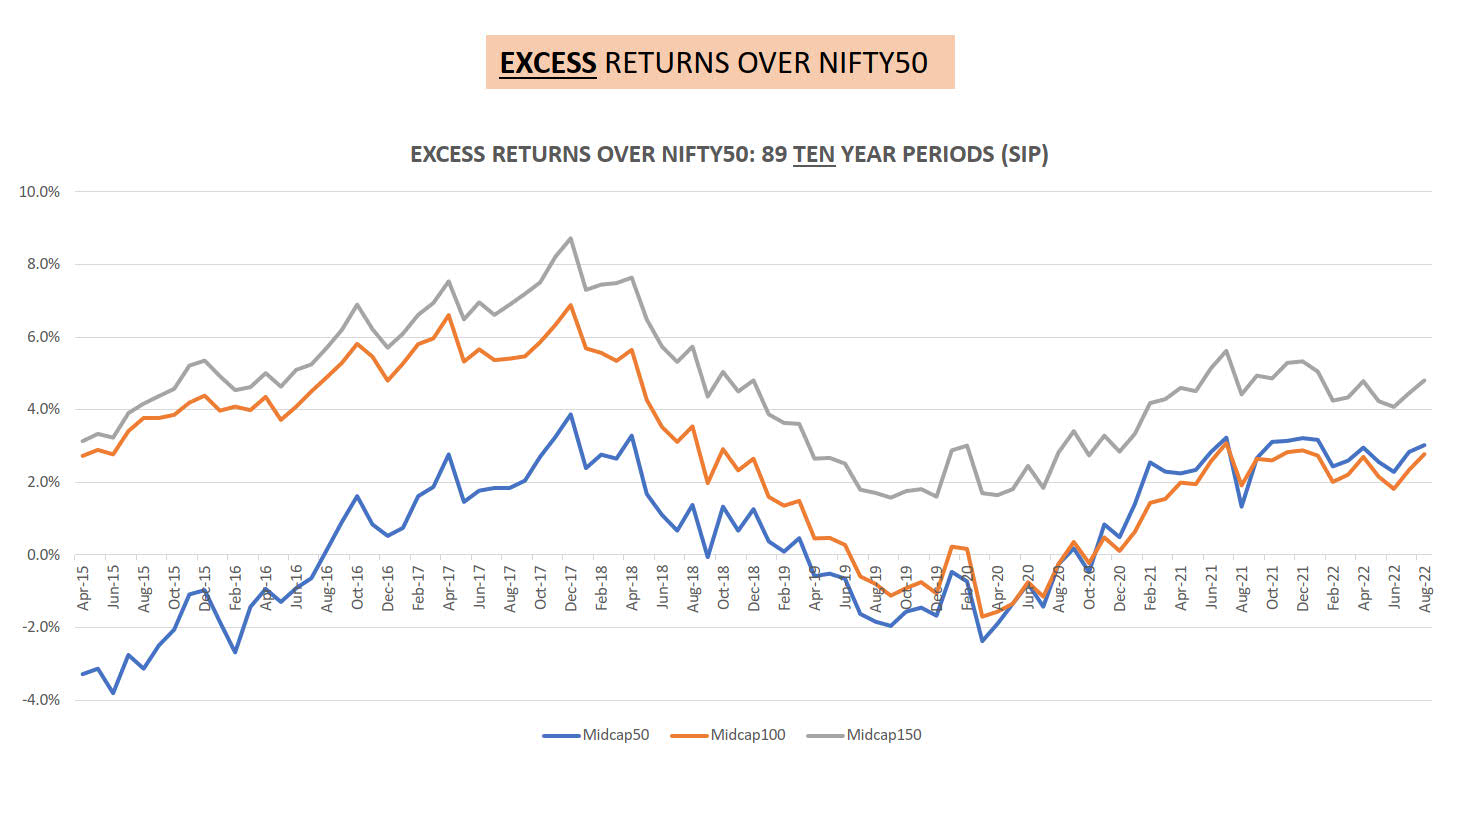
We get 89 Ten Year Periods starting from April 2015 until August 2022. Some basic commentary on the above charts:
Midcap 50: The average excess return is 0.6% and it is the worst performing index, just like the 5 and 7 year periods. The Std Dev is 2% and range is 7.7%. It had excess returns in only 61% of the periods.
Midcap 100: You can see that this index closely mirrors the Midcap 150 but with lesser returns and also had periods of negative (excess) returns. The average return (2.7%) is lesser than the Midcap 150 and it had excess returns in 85% of the periods. The variation (Std Dev: 2.2%) and range (8.6%) is lesser than the Midcap 50
Midcap 150: This index had excess returns in ALL the periods. The average return of 4.6% and while the variation (Std Dev: 1.7%) and range (7.1%) is the least amongst all the indices
ABSOLUTE RETURNS
The chart shown earlier give relative returns i.e. Returns in EXCESS of the Nifty50. As done in the previous analysis, a Cumulative Relative Frequency charts shows the ABSOLUTE RETURN. You can see the same on my BLOG.
For those interested, I have also compared the Midcap 150 vs the star of the previous section-Nifty Nxt50 for 5/7/10 yr periods and have posted the same.
CONCLUSION
The Midcap 150 undoubtedly performs the best of all the three indices. Also the larger number of stocks in the index, the better it has performed. Thus, the Midcap 150 > Midcap 100 > Midcap 50.
In regards to performance of the Midcap 150 v/s the Nxt50, the Midcap had better performance than even the Nxt50. However until 2014-2015 it was underperforming the Nxt50. Also there is a kind of a breakout outperformance since August 2020
The same caveat mentioned in the previous analysis applies here too: Since the above data is a presentation about the past, we can neither extrapolate the outperformance findings nor can extrapolate the generalized findings into the future and I humbly request you to be MINDFUL OF THE SAME.
| Subscribe To Our Free Newsletter |
