
ArmanFinancials
Tried to analyse this but it seems to be one of the trickeiest charts.
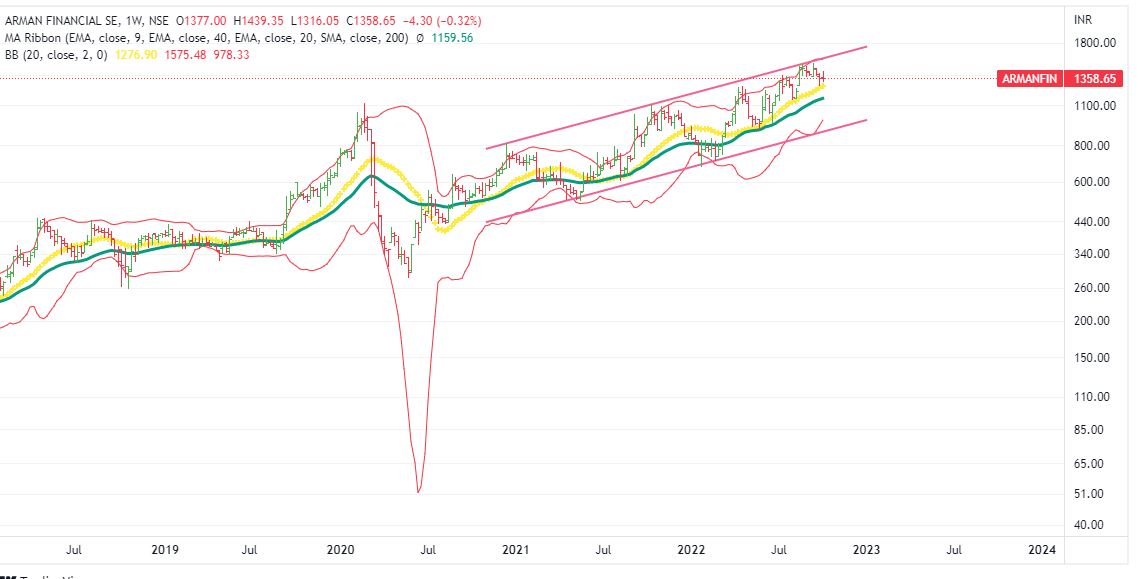
All the moves have been overlapping and can’t see any clear wave structure ,so difficult to guess the long term move as of now.
Only thing that is visible is that it is trading close to upper channel – hence can move down from there. If someone has to enter ,he should wait for a weekly close above the channel.
We tend to stay away from these type of charts. There are 100s of other cleaner charts where one can convincingly make few alternatate projections.
| Subscribe To Our Free Newsletter |
