
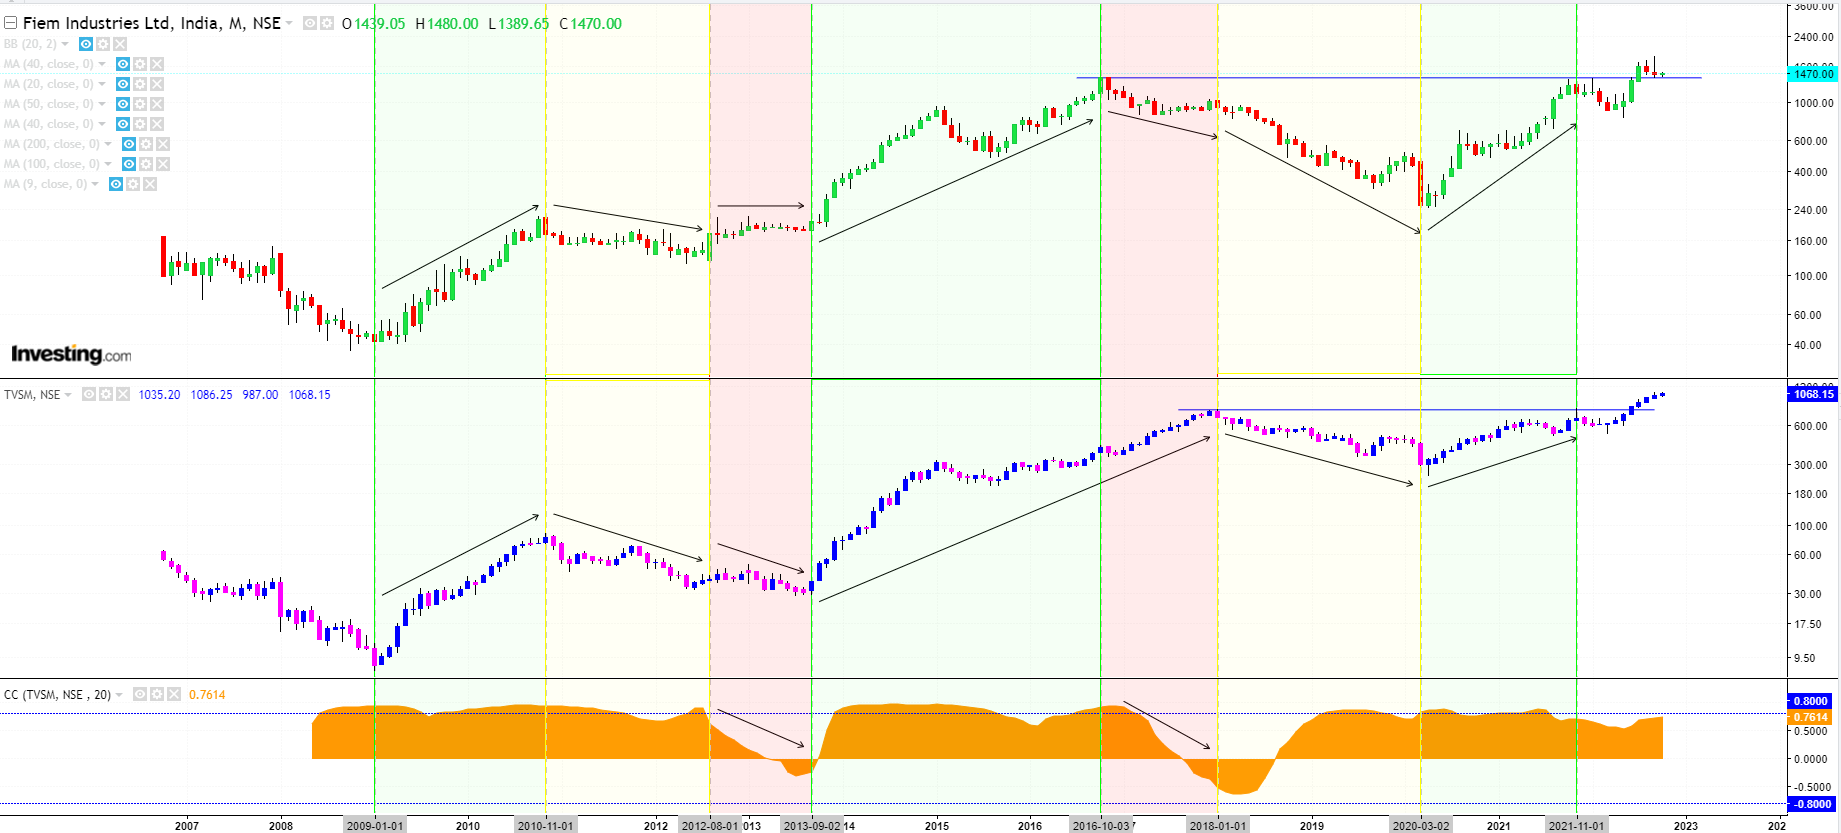
Analysis of the High Correlation in price movements between Fiem Ind and one of its top clients TVS Motors::
Long trending up and down moves are highly correlated > 0.80-0.85 ( Green & Yellow Zones)
2 instances where Correlation turns from positive to negative (Red zones)
Both stocks breaking out of 5-6 year plus bases. Correlation still maintaining at 0.76-0.80.
| Subscribe To Our Free Newsletter |
