
Jubiliant Foodworks
We might see a short term B wave rally (Bear market rally) .
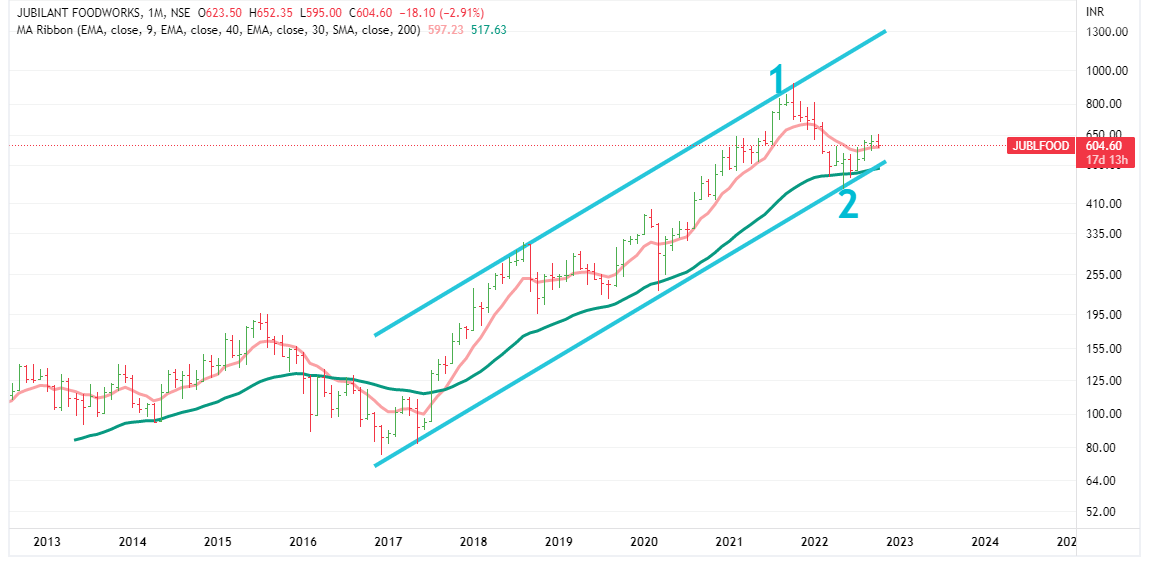
In longer term, if we check monthly chart it seems that it has ended its long term bull run and now it is corrective mood.
Monthly Chart
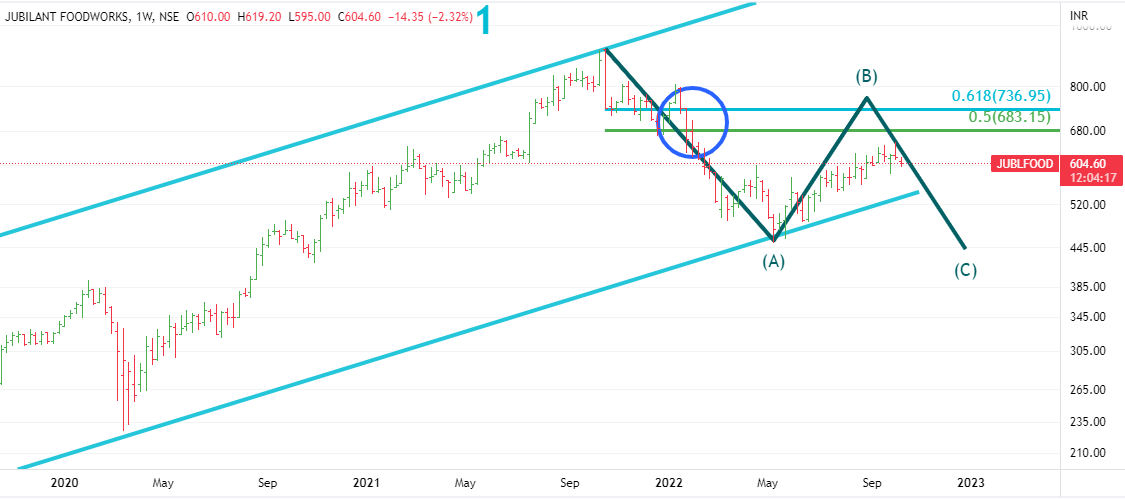
On weekly chart, we see a B wave bounce going on. That might take it 50 or 61.8% retracement of wave A ( 685/735) that also coincides with the top of red ED bars ( in blue circle) .If we cross the same,we might have double-top ( highly unlikely)
After B wave bounce, it should start wave C ,that might take it 450-500 levels – ie. 50 % of whole bounce since 2017 and lower end of monthly BB and in worst case scenario A=C .
This scenario may play out in next 6-9 months as we’re looking at weekly and monthly charts.
Weekly Chart
Disclaimer :This post is just a for learning a method. Views are personal. No buy/sell recommendations. These are probability study methods and chances of success depend upon various factors.
| Subscribe To Our Free Newsletter |
