
Tesla
CMP 205
We covered this stock in April , The stock was at 876 ( it was split 1:3 ,so as per current calculation ,it was at 292) . Our projection was that it should go to 700 ( 233) in first phase of the fall.
Now it has already crossed the first phase of fall . Let’s see where it would go from here.
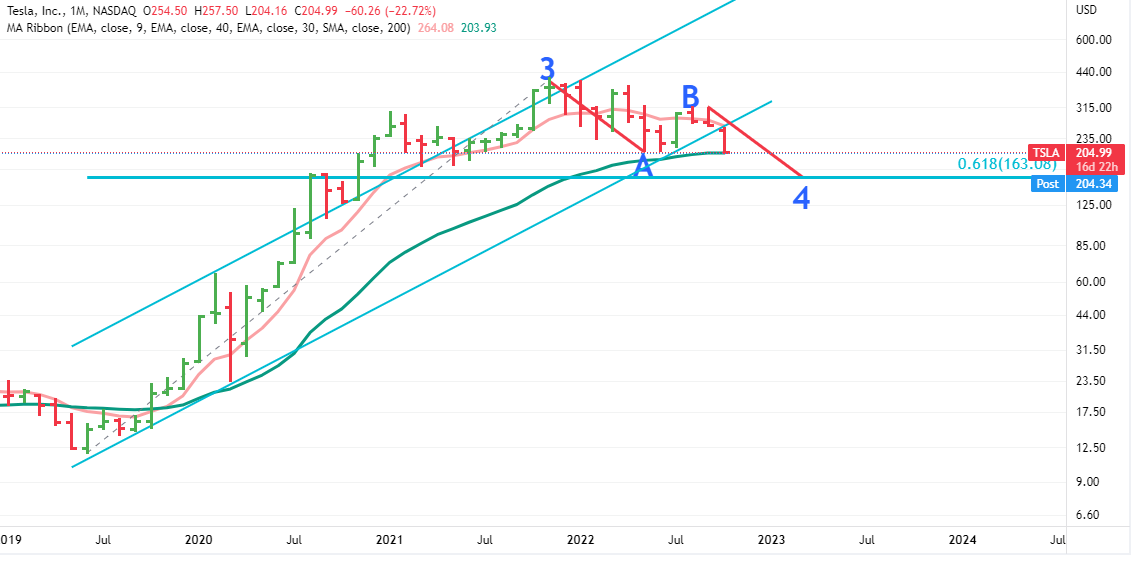
As per monthly chart, it is currently at 40 months moving average ( month is yet to close) . If ot breaks this level, then next stop can be between 180-185.
And of it breaks that level also ,then the next stop would be very crucial- that is near 160-165.
160 -165 is an important zone –
a) It is lower end of monthly Bollinger Band (bit dynamic level as it keeps changing as per the price movement)
b) This price zone is also at the level of 61.8% Fib- retracement of the whole 3rd wave that statred in 2019
c) This is also the zone where A=C
Monthly Chart
Keep in consideration that it won’t happen overnight . Currently it is at lower end of weekly BB and Nasdaq might start B wave bounce anytime so it might fall a little more and then can move up a little (225-250) before strating its next leg of fall.
Disclaimer :This post is just a for learning a method. Views are personal. No buy/sell recommendations. These are probability study methods and chances of success depend upon various factors.
| Subscribe To Our Free Newsletter |
