
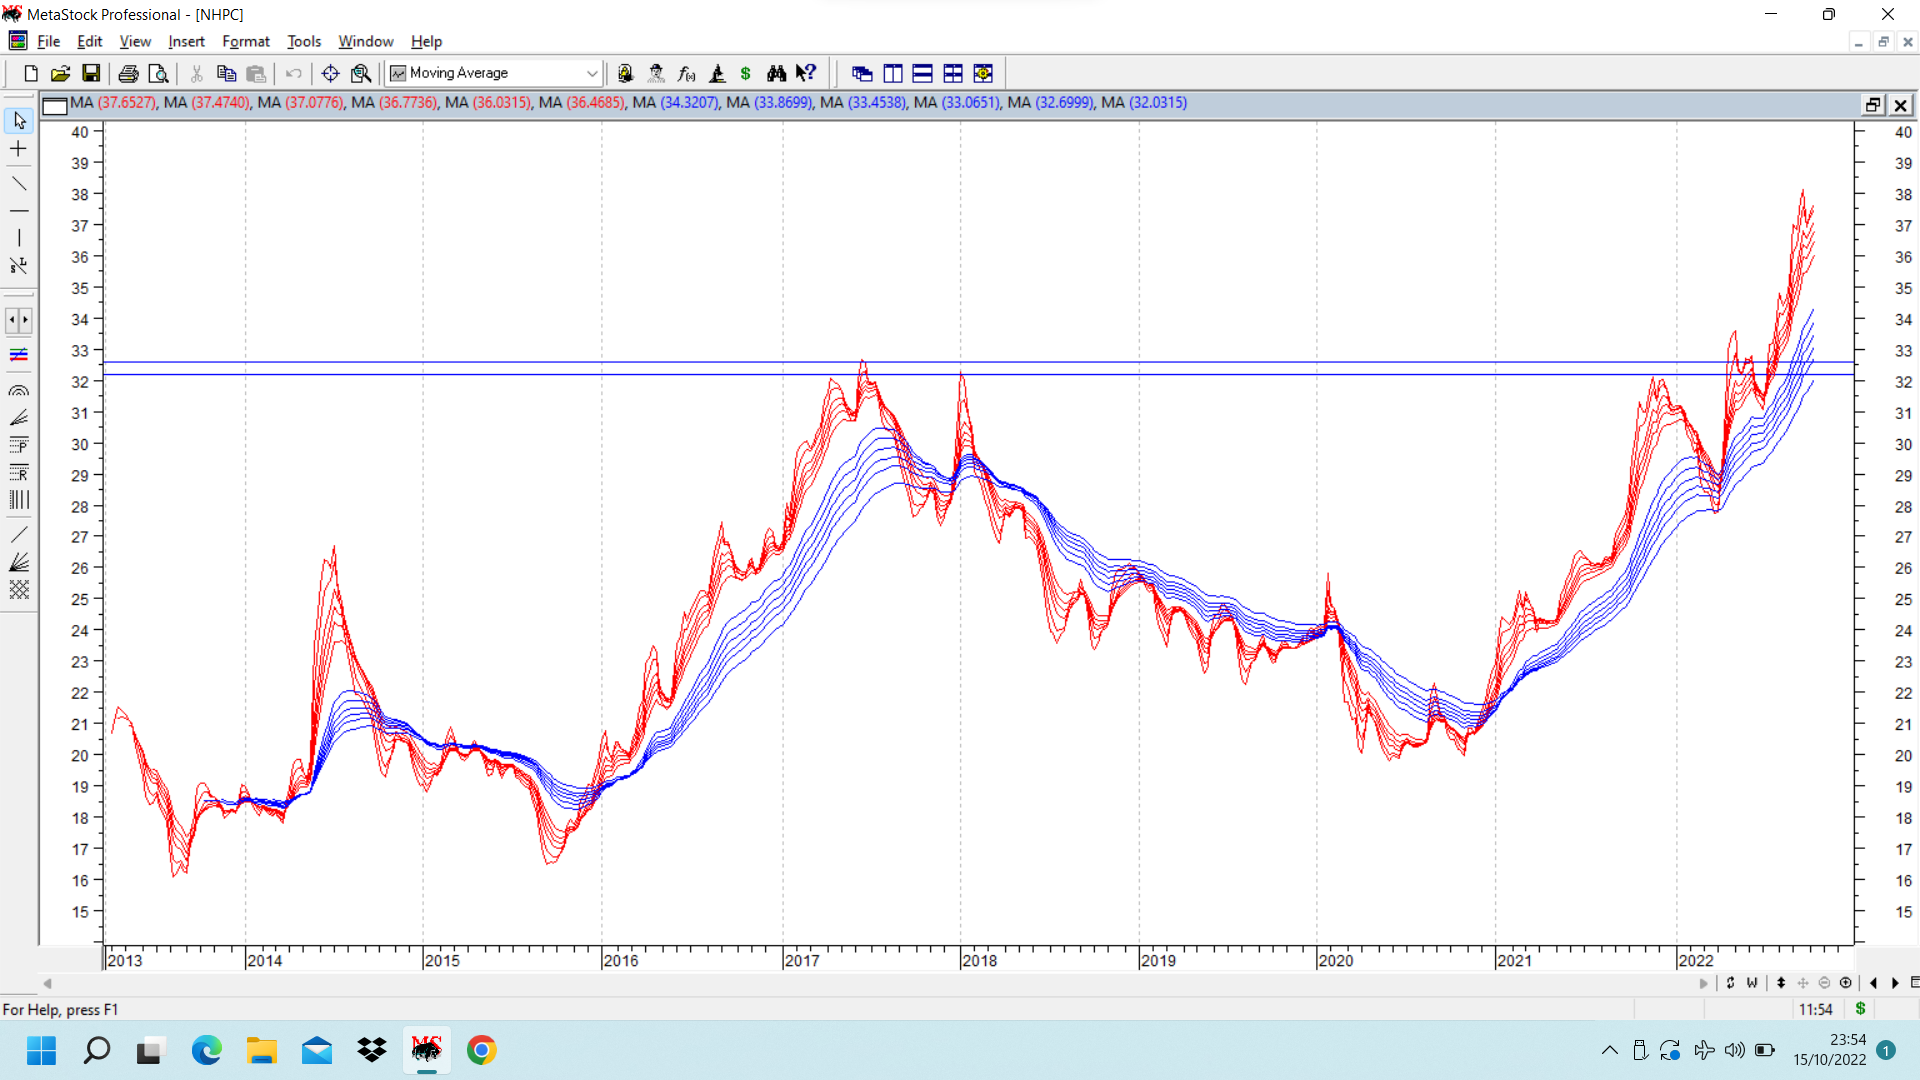
NHPC has been a steady performer in this current weak market phase. As shown in the attached weekly GMMA chart, its important resistance was the band of 32-33 ( on bar chart it crucial breakout level was 34.50 and a previous less important peak in 2010 was 36.60) … So for practical purposes, we consider levels of 33-34 as important breakout levels. And stock price has managed to stay above that level most of the times recently and has had an ocassional shot at a new swing high of above 40.
Stocks like NHPC currently are showing relative outperformance ( or resilience, by not going down along with market weakness). as compared to nifty. My guess is once the market stabilises, and some kind of triggers are unlelashed for NHPC, or there is some fancy for renewable energy of any form, NHPC can make a move. Till that its waiting time. A solid dividend yield is also helping in terms of downside protection. Target of attached pattern is around 45.
Whenver stocks break out of strong resistances, they either run up straight away, or most of the times, tend to hover in and around the previous resistances, sometimes going slightly below the crucial levels also, as a sort of shakeout move, to shake out weaker hands, and then make the big move. In real time its difficult to make out which stocks are going to do what.
If you track HBL power, its previous major top was at 76-77. When stock price cleared that level, it went up to 105, and then again retraced to retest levels of 74-75, and then gave another rally to 104, and again retested 74-75 and then on third attempt at levels of 100 plus managed to conclusively break above that and since then has been showing good strength and resilience.
Based on my experience of stocks clearing all time highs, my expectations in terms of targets are usually 30%, 50% and 100% percent upsides (and subsequently multibagger in some stocks) from previous tops… (there is no science attached to it, just mere observations after seeing lots of such breakouts. )
| Subscribe To Our Free Newsletter |
