
GPIL
My friend ,sorry to say that these days ,we don’t have many upbeat news to share as we’re in a bear market. (in bull market ,you won’t need us as when tide goes up even the stones start floating)
First sign of weakness is that it is trading below 20 MMA (monthly moving average)
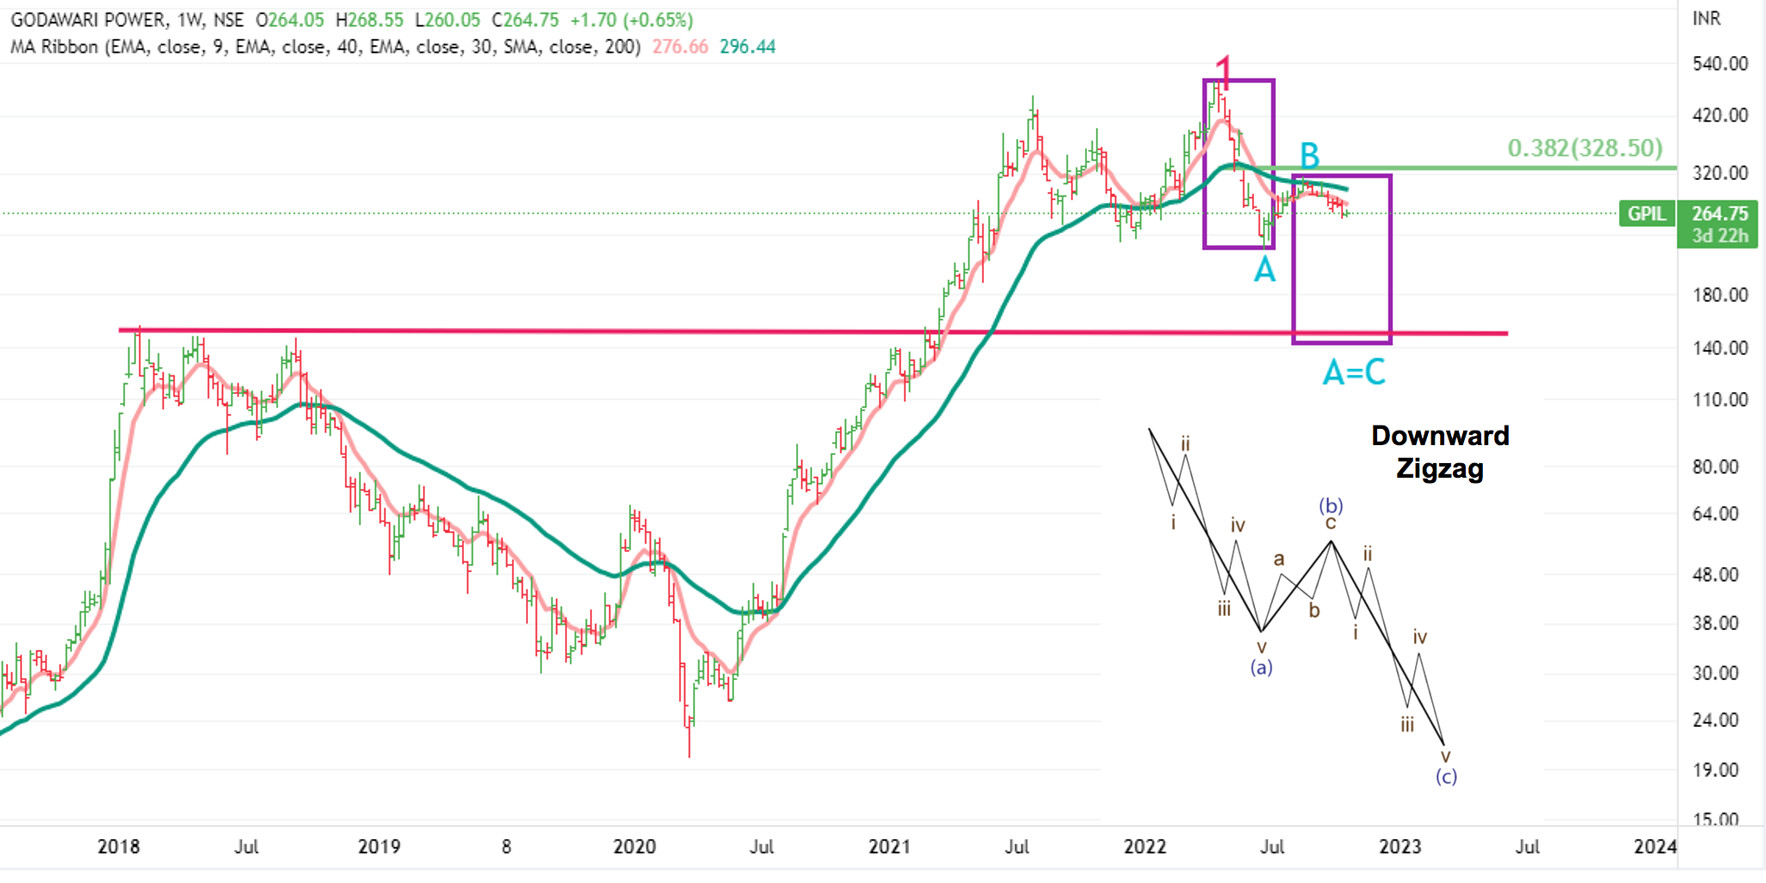
On weekly charts, GPIL seems to be in a Zig Zag correction where wave A has 5 legs, B has 3 legs and then C again has 5 legs. Generally C happens to be equal to A (in % ge terms) but in severe bear markets, C becomes much longer.
Currently it seems to have started C. Now where it will go ?
First stop can be 40 MMA ie between 210-220. And if it does not stop there,then target for C can take it down much further . And we can also see a support there -red line) .Won;t write the number here as few may get goosebumps. Would request to check the chart . Let’s pray that it does not happen.
Weekly Chart
Keep in mind that weekly chart are seen to know 3-12 months movement so don’t expect anything in jiffy.
Disclaimer :This post is just a for learning few methods of price-patetrns. Views are personal. No buy/sell recommendations. These are probability study methods and chances of success/failure depend upon various factors
| Subscribe To Our Free Newsletter |
