
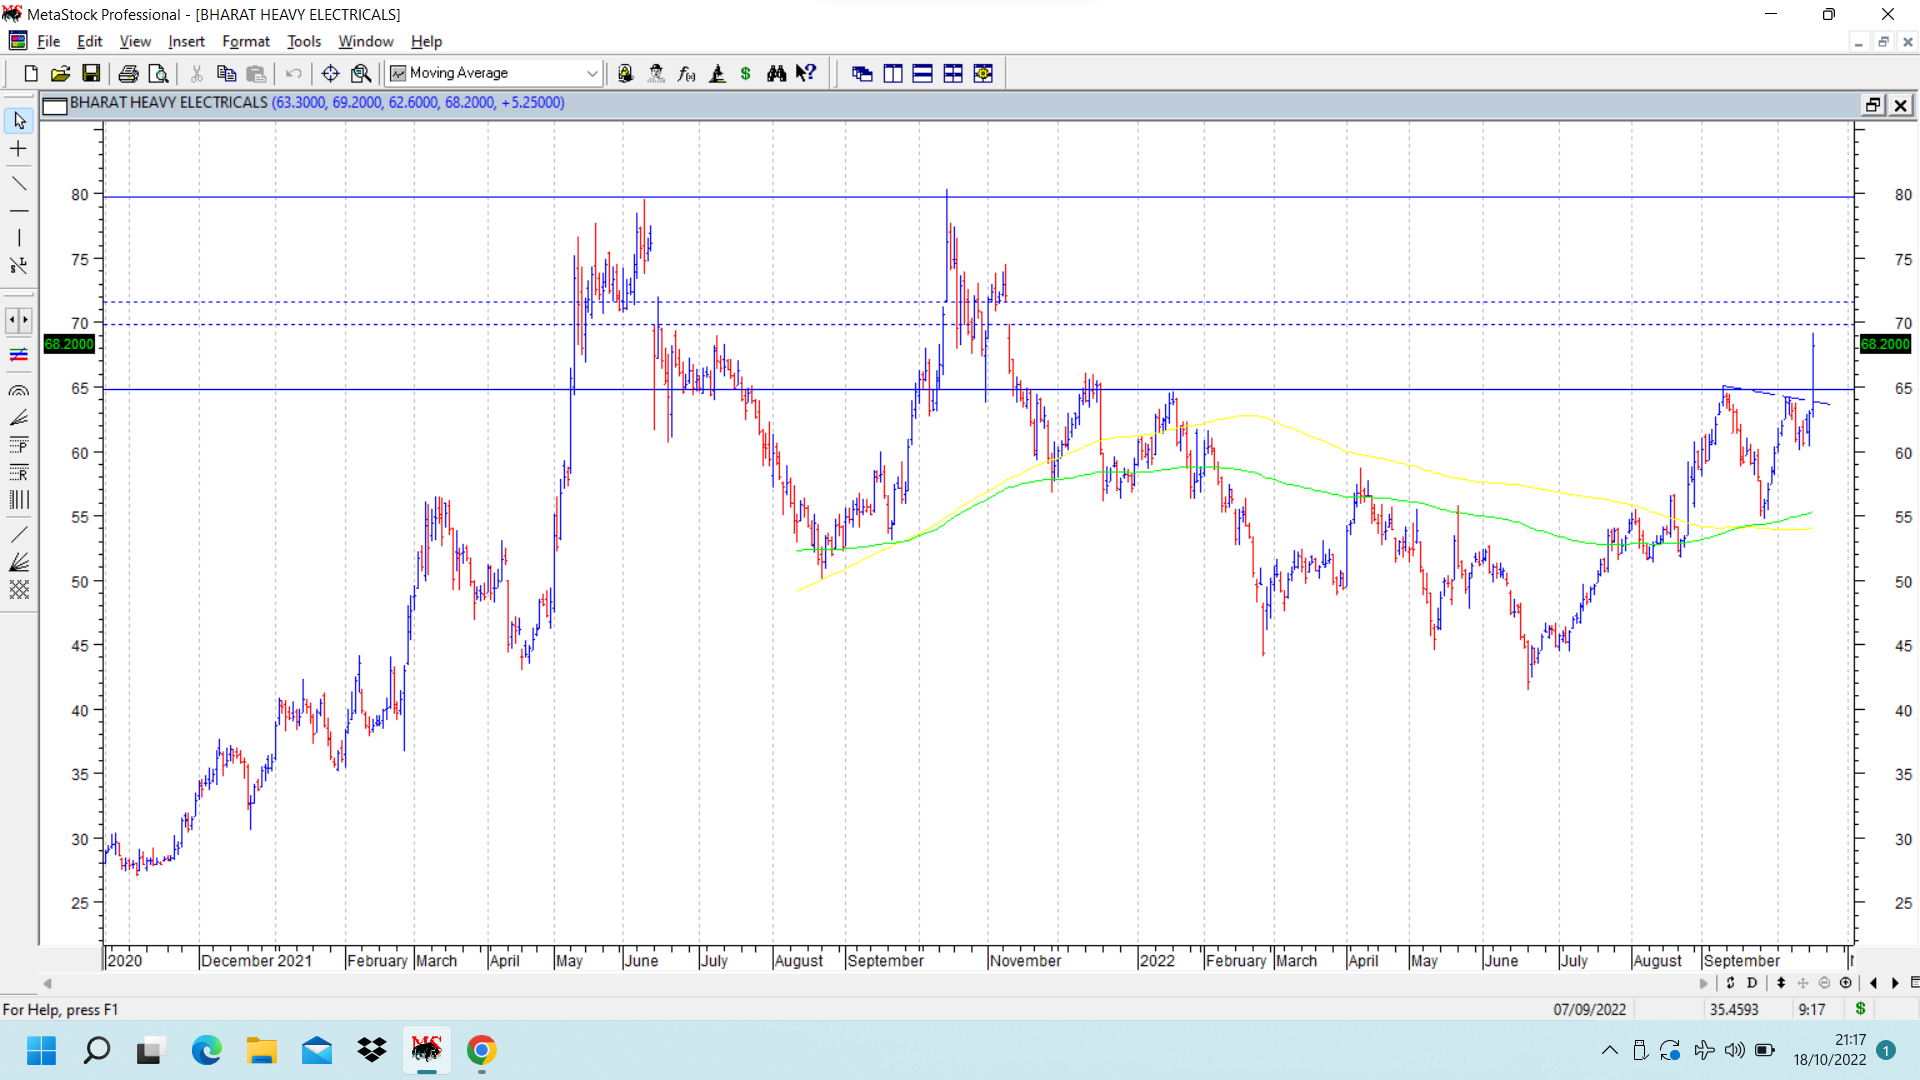
BHEL chart covered earlier. Main theme was that a failed bearish pattern can provide a potentially good upside trade. Today stock price broke above (with huge volumes) a strong resistance of 65, which also is a neckline region for an inverted head and shoulders bullish pattern. If this pattern plays out, target can be 85 plus. Near term the falling gap marked in dotted parallel horizontal lines between 71.60 to 69.85 should be watched for resistance. Above that 85 is a potential resistance. Also note a small cup and handle pattern marked on right side of chart which also happened to be the right shoulder of the aforesaid inverted head and shoulders pattern. disc: invested.
| Subscribe To Our Free Newsletter |
