
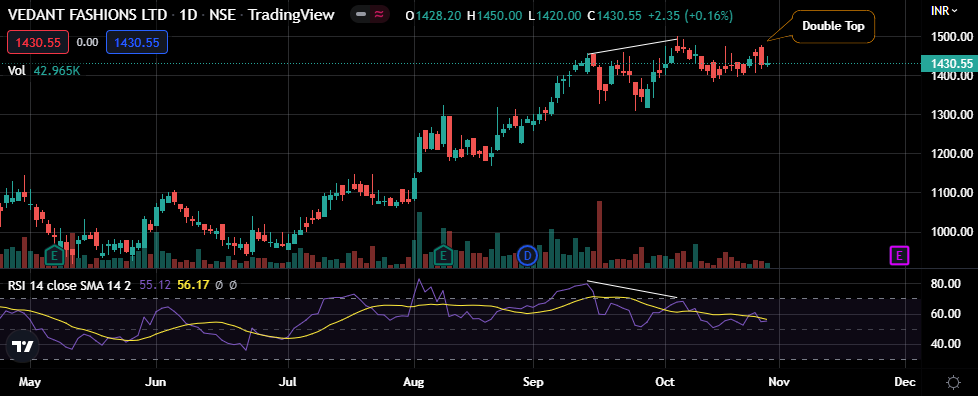
MANYAVAR [Rs 1430] 1D Daily Chart
(a) Bearish Divergence: Higher top on Price candle, Lower top on RSI
(b) Double Top: Price attempting make another same level previous top, with weak candles, with weaker RSI
Chart’s bearish sign is at early stage, as HH-HL trend is still intact,
Confirmation on bearishness required, if price close below previous swing low 1380, coinciding with Pivot and 50EMA.
Contra view:
(a) There is a bullish view on the stock in this forum on 01-Oct at Rs 1408
(b) There is bullish view on the stock by Samir Arora on 06-June at Rs 1100
| Subscribe To Our Free Newsletter |
