
JBMA [Rs 417] 1D Daily Chart Home – JBM Group
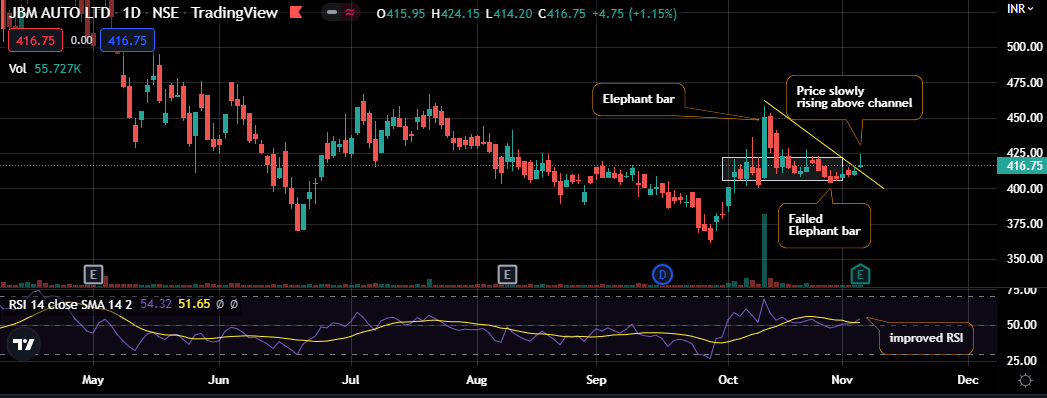
Price staying in compressed zone for a month-long period
Attempted break out, but resulted in a failed Elephant bar [Oliver Velez]
Recent candle has again shown attempt going upward of channel
There is very slight improved RSI, but bullishness confirmation is missing
One candle of size Rs 15-18 with upper quadrant closure may confirm the upward trend resumption.
Contra view: Current price is almost 10% below 200 day moving average
Fundamental
Market Cap Rs 4928 Cr
TTM Sales Rs 3788 Cr
Company has announced quarterly result yesterday
YoY changes
Revenue from Operation +30%
Earnings per Share +40%
Stock PE 27
RoCE 13.5%
| Subscribe To Our Free Newsletter |
