
There is some evidence to this at least in the past
FY19 closing inventory was abnormally high as compared to previous years (and in retrospect, the year after as well in FY20 closing inventory / inv. days)
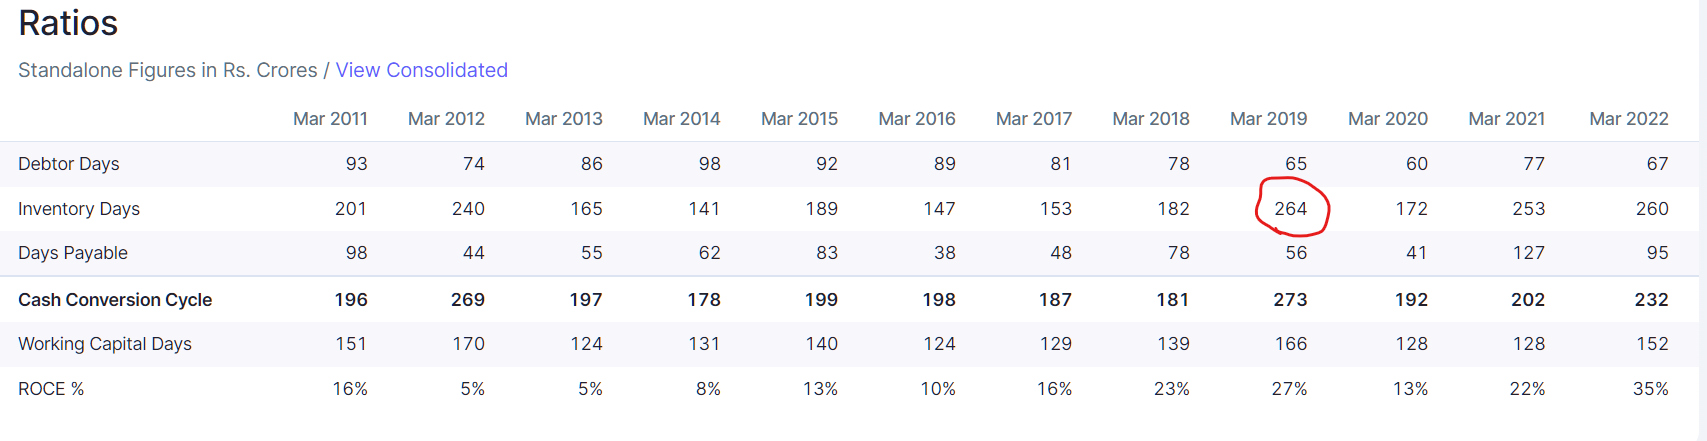

And consequently, FY20 gross margins took a hit (Correlates nicely with Cu/Ni price chart)
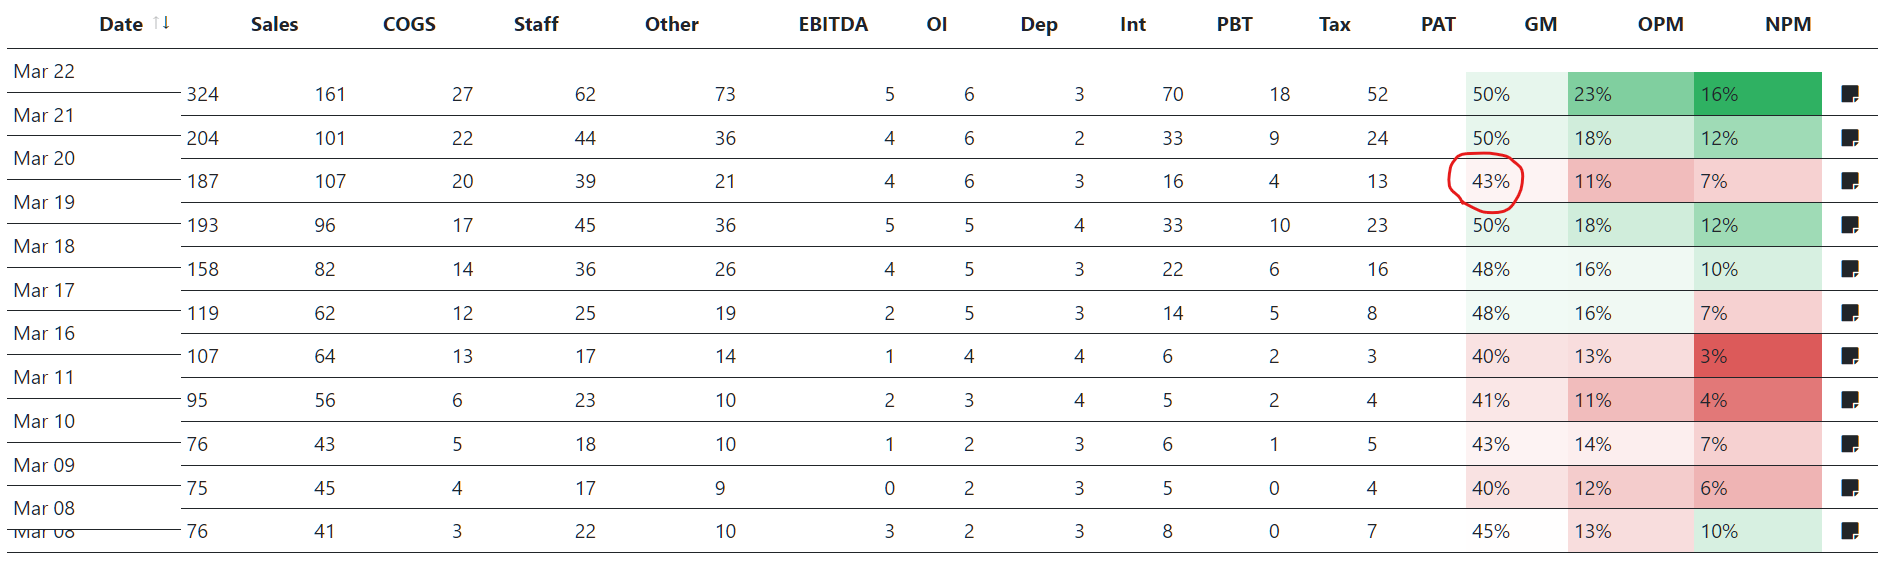
Currently as well similar deterioration is there in inventory days but a similar hit to gross margins isn’t present (at least so far), though inventory days for FY21 and FY22 have been both at an above average 253 and 260, FY22 gross margins were at 50% like FY21. However in the two quarter in FY23, there is deterioration towards 47%, which makes it bit tricky to conclude its all volume/value led.
Its still maybe a couple of quarters too early to conclude. RM prices have continuously gone up and stayed up during the period in question (FY22), except in the last 3 months when it has gone down – If next couple of quarters, the GMs stay closer to 50 than 40, we can conclude with a higher probability that its volume and / or value led growth. Until then its anybody’s guess.
Disc: Have traded in the past here
| Subscribe To Our Free Newsletter |
