
Green Panel
It had a good run from 24 to 630 in 2020-2021 ( Wave 1).
Now it is is correction zone (Wave 2).
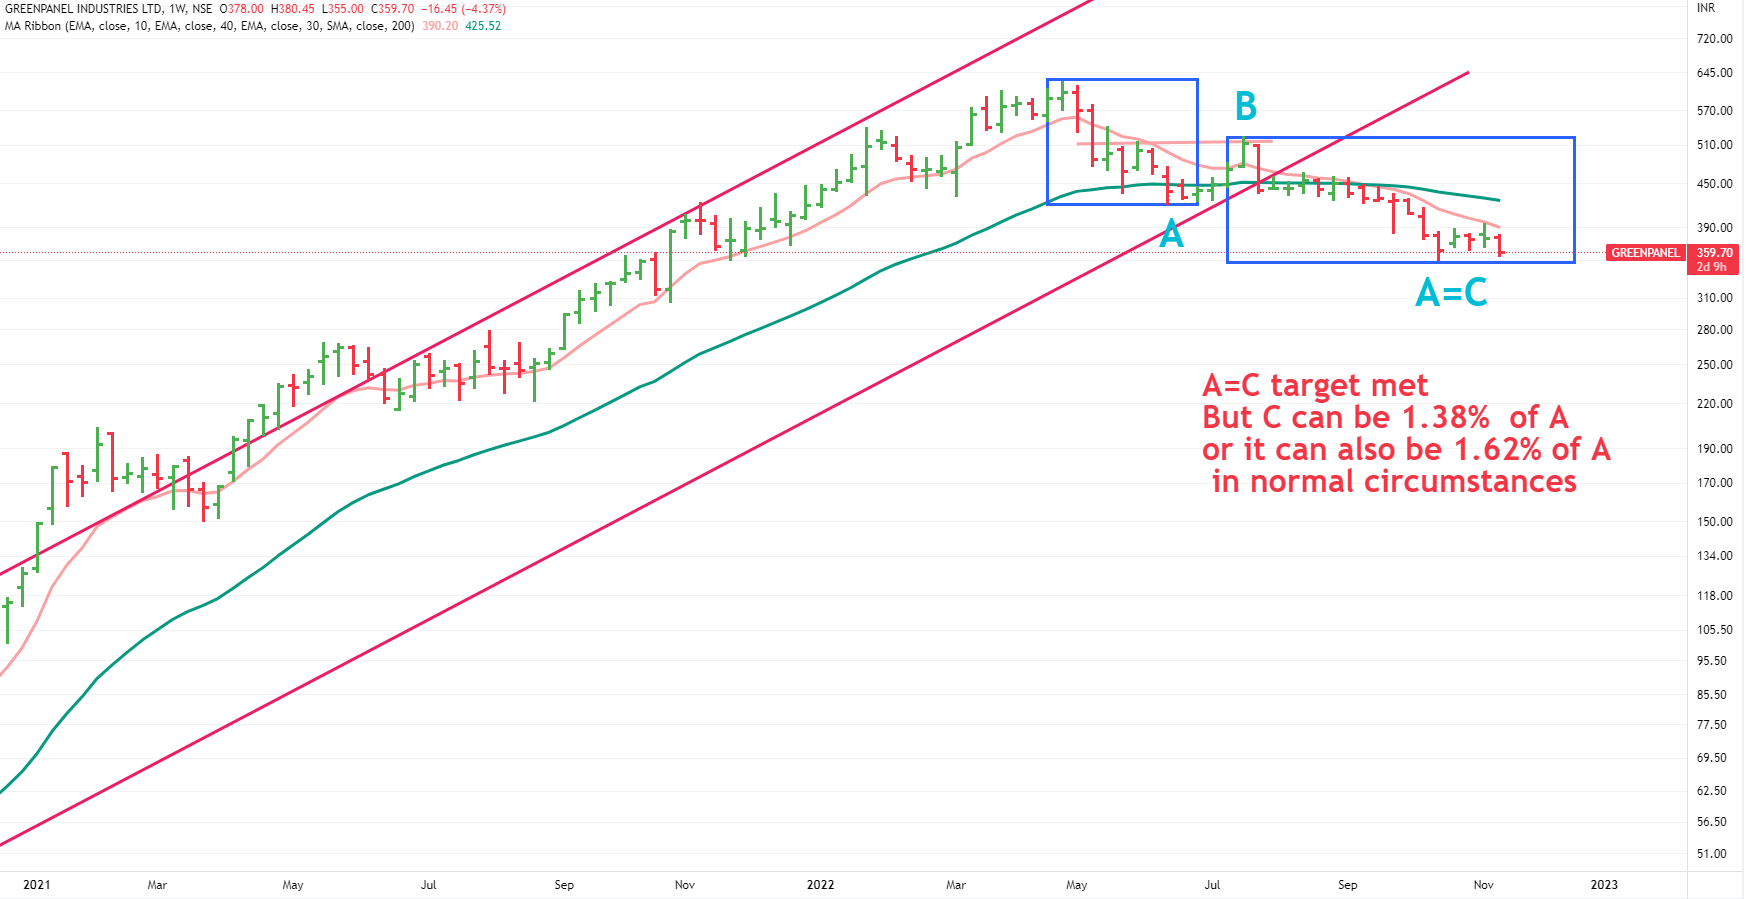
As depicted in the following chart- Wave C has met the first target ie. equivalent to C.
But it is yet to show the signs of stopping here as recent candles are not so encouraging as well as MACD is in sell zone in all timeframes ( daily/weekly/monthly) .
In these cases , wave C can be 1.38 % of A or 1.62% of A. (if a company commits fraud or overall market crash happens then price can go beyond these levels)
Better to wait and watch here – if it breaks previous low of 351, it can go to 290-300 (1.38% of A)
Worst case : if it does not stop there , a bottom should be made near 260 level ( 1.62 % of A) .That is also a level for 61.8% retracement of whole rise.And we also have a strong support between 260-270 levels.
Disclaimer :This post is just for learning few methods of price-patterns. Views are personal. No buy/sell recommendations. These are probability study methods and chances of success/failure depend upon various factors
| Subscribe To Our Free Newsletter |
