
LTI
CMP 5135
Like most of the other IT stocks , it is bouncing back.
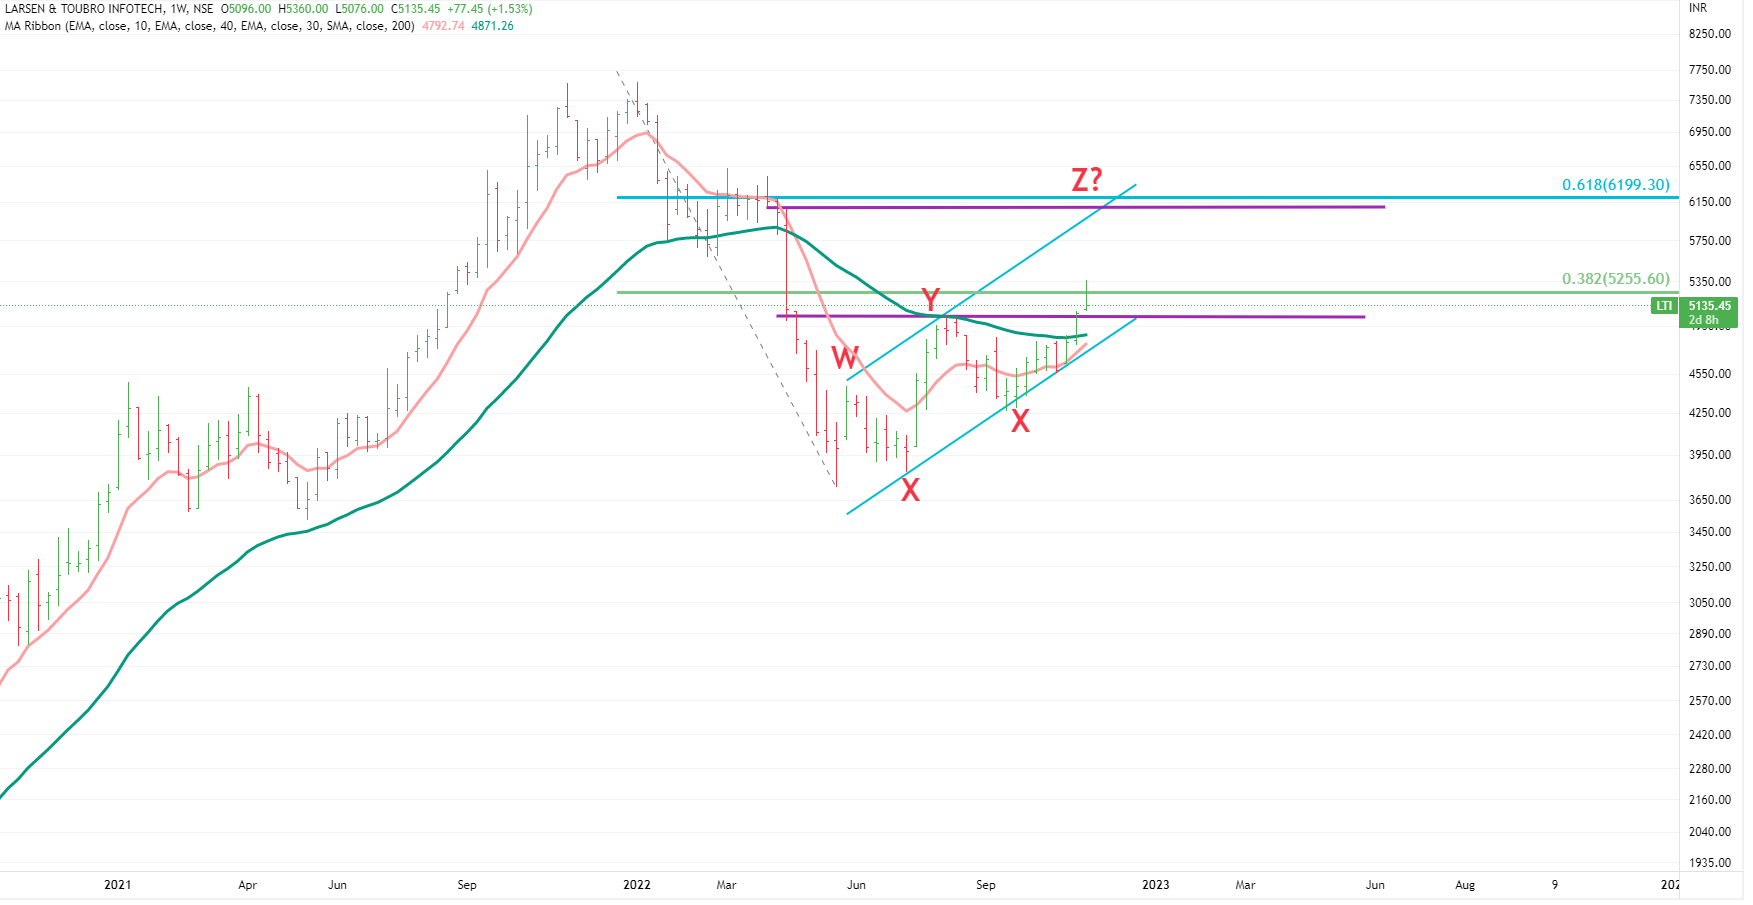
It completed wave 1 in Nov 2021 and then corrected upto 61.8 % of whole rise in May 22. Many a times ,good stocks finish their corrections (wave 2) at this % of retracement.
Now the debate is – whether the rise after May 22 is a fresh wave (wave 3) OR it is a just a corrective rally . We’re currently considering it as a corrective rally due to macro -scenario,
As per the weekly chart, it can move upto 6100-6300 levels (wave Z as well as 61.8 % retracement of whole fall since May 22) . In short , it can keep moving between 5000 -6200 for next few weeks/months .The condition is that it should not break the lower purple line ie near 4900-5000. (in very short term, we might need to be extra watchful)
If t crosses and closes above 6200, we would review again . Whether the current rally is really start of THE next bull wave or there’s something else.
Weekly Chart
Sorry ,unable to provoide a very definite path . But that’s life, we need to tread between unceratinities to move ahead…
Disclaimer :This post is just for learning few methods of price-patterns. Views are personal. No buy/sell recommendations. These are probability study methods and chances of success/failure depend upon various factors
| Subscribe To Our Free Newsletter |
