
Canara Bank
Currently we’re in Vth wave of fresh impulse that started in May of 2020.
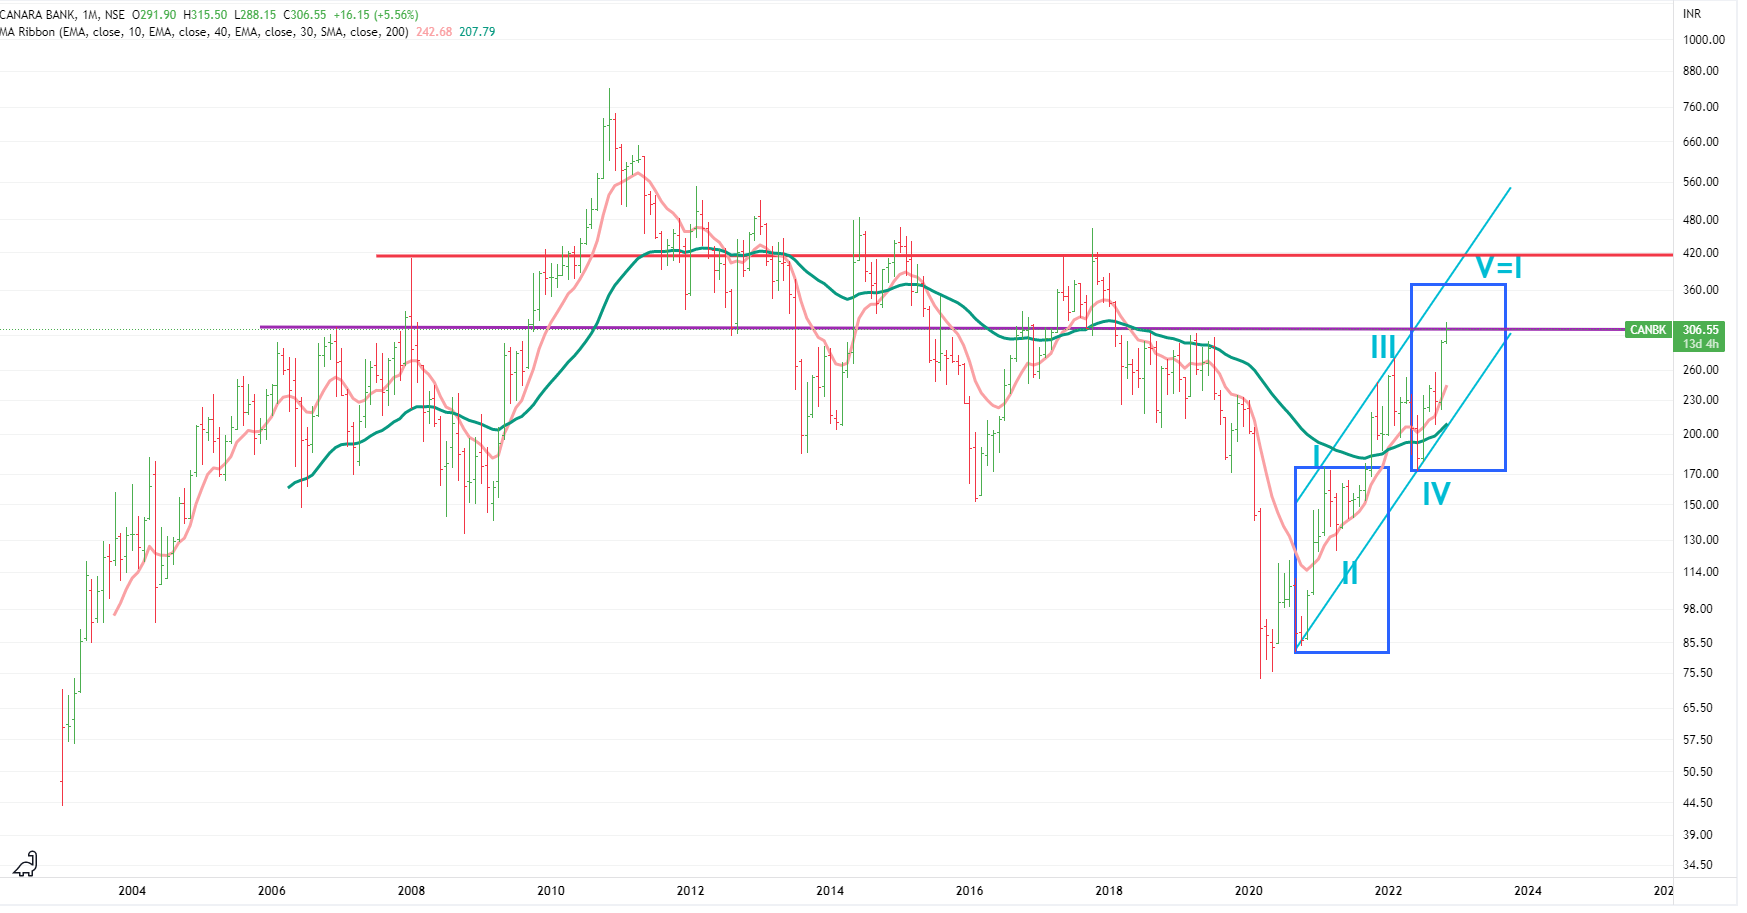
Let’s first look at the bigger,longer time-frame picture from the monthly chart .
As per EW ,two waves out of three upside waves (1st, 3rd and 5 th) are supposed to be same length.
In this case, it seems that wave I and wave III were of same length. So wave Vth can extend i.e. it can be bigger than Ist and IIIrd wave.
If we take I and V equal ,the target comes near 360-370. But if consider extension, it can go upto 400-410 . That also happens to be near the upper end of the rising channel as well as a storng resistance can be seen near those levels (red line ).
Once it completes this comple wave then bigger correction would set-in.
Monthly Chart
In short term-
We happen to be in a congestion zone between 290 to 315 (purple line ). If the overall market starts correcting ,then it can linger in this range . Also stock has moved very fast in recent past, hence it needs to take a pause (time-correction) before it starts its next leg.
Welspun Corp -we already shared it in the past. Please check the thread.
Disclaimer :This post is just for learning few methods of price-patterns. Views are personal. No buy/sell recommendations. These are probability study methods and chances of success/failure depend upon various factors
| Subscribe To Our Free Newsletter |
