
Tata Power
CMP- 221
Well this came out of consolidation after 12 years ( from 2008 to 2020 it was in a correction zone ) . It sarted new wave in March 2020 ( wave 1 of fresh wave) and became > 10 X in less than 2 years.
Now it is doing its price and time -correction since January 2022 in wave 2.
Long run it is bullish as when wave 3rd will start ,then it would move very fast and can again become a multibagger.
But we plan to enter fresh, we need to wait for the end of wave 2 and that wait can go for many weeks and months.
One of the likely scenario if the market conditions remain choppy.
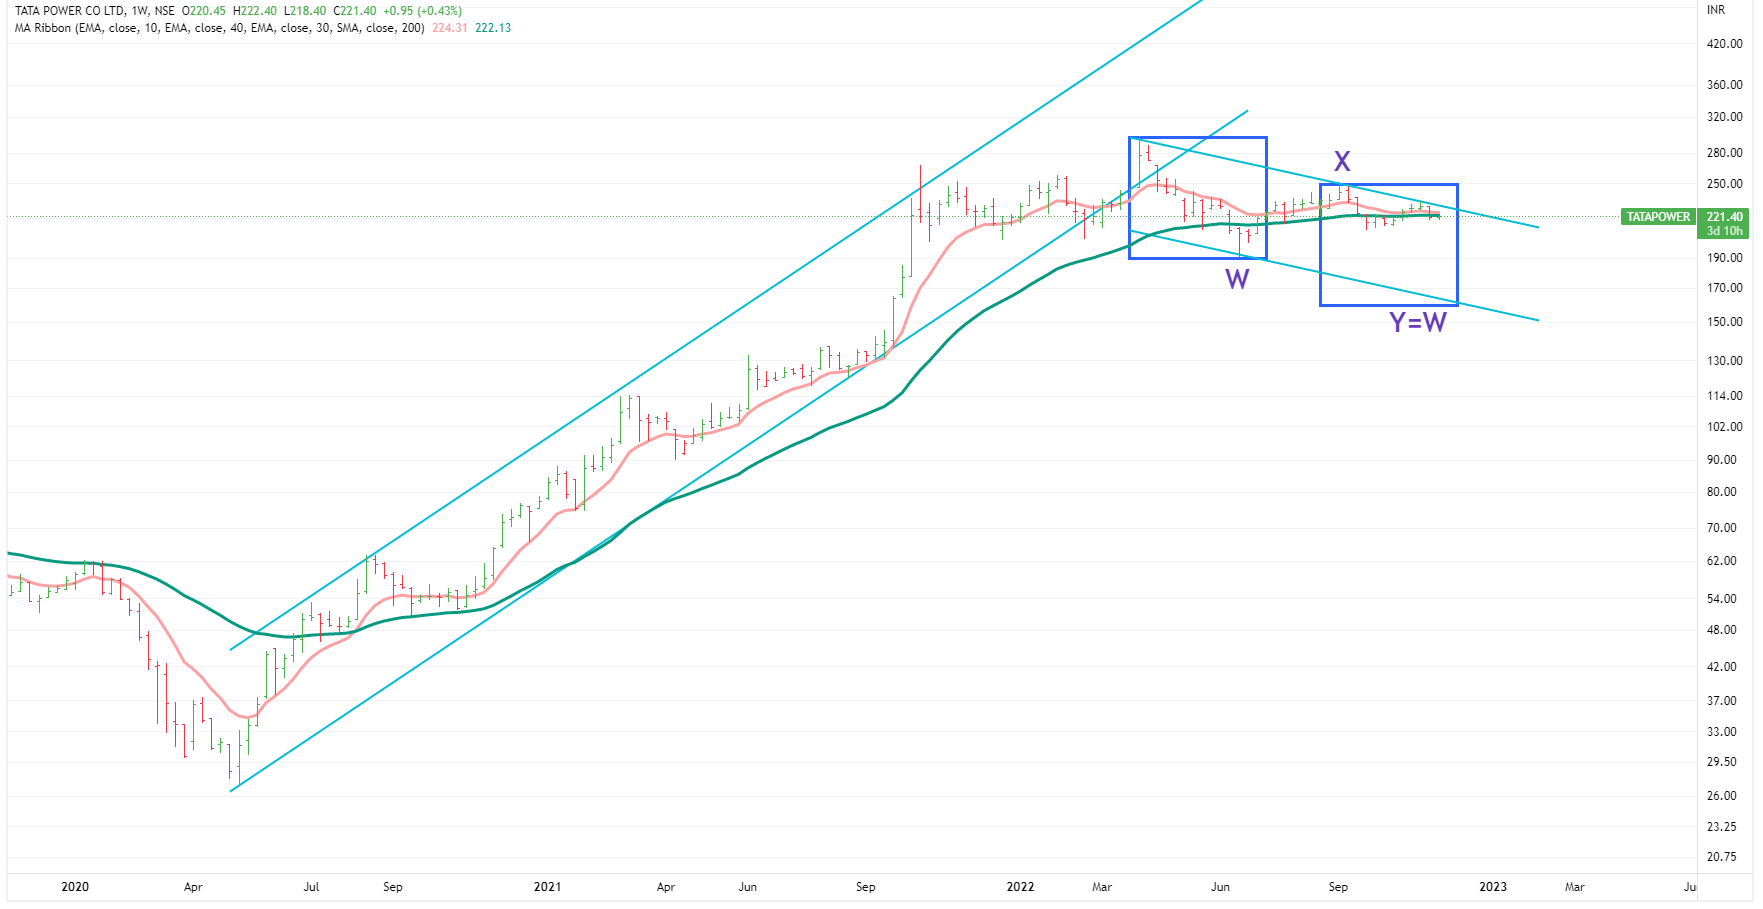
Weekly Chart
It might be now in wave Y . If this is true ,then it may go near 160 in coming months.
At 160 level , Y=W and it is also the lower end of the falling channel.
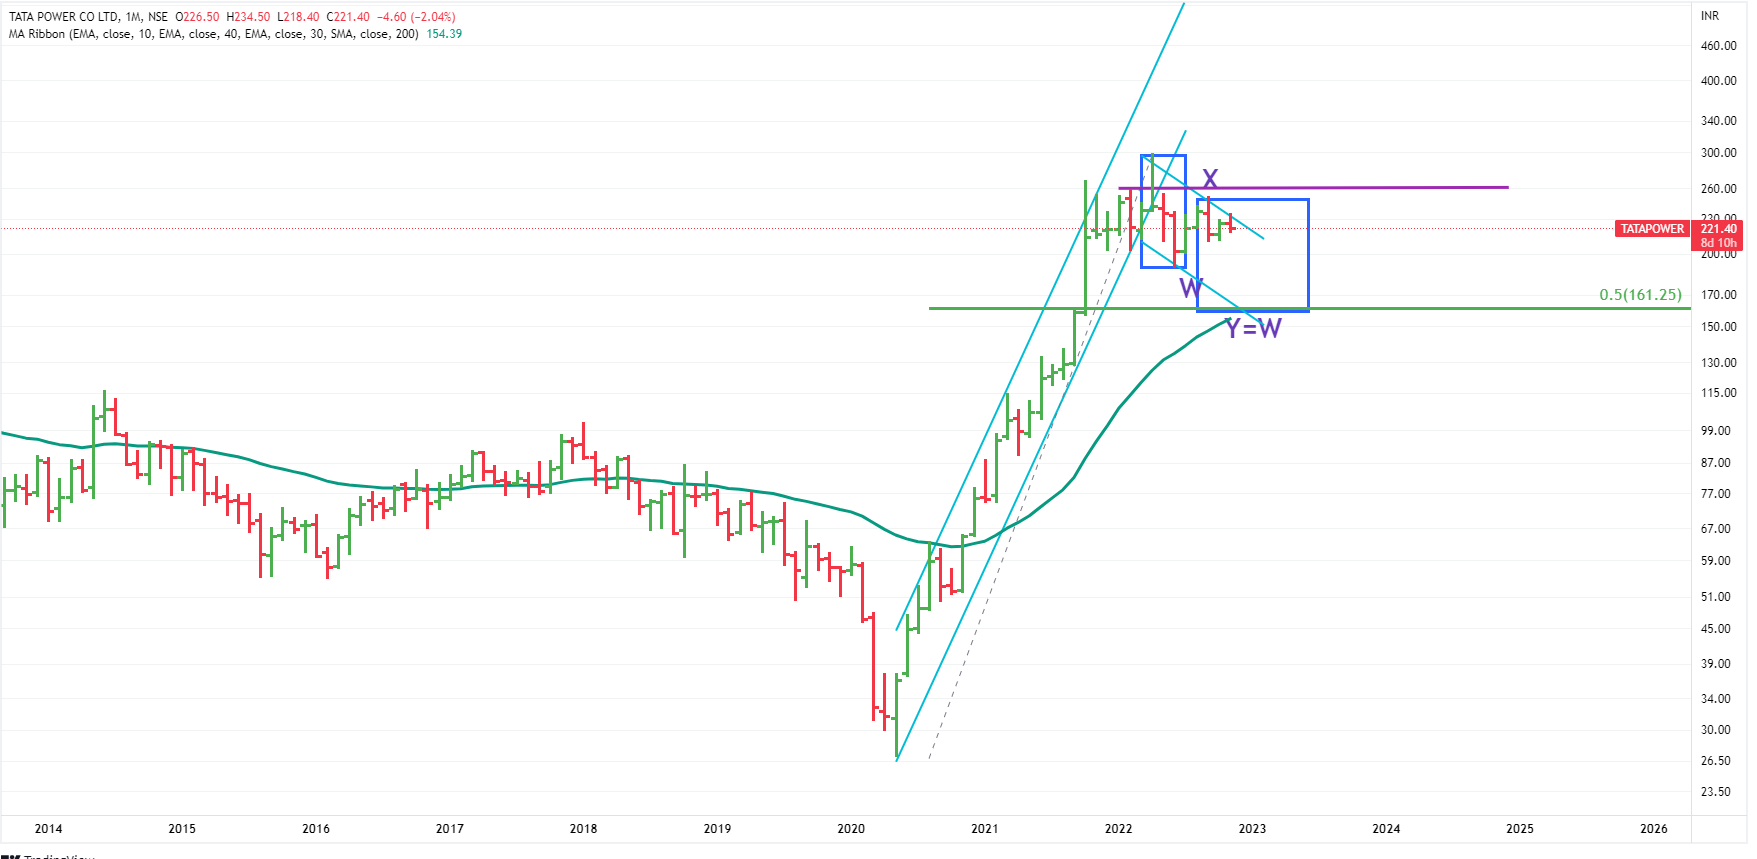
On monthly chart, MACD is in sell mode and 40 week moving average is also near 160 (40 MMA ) and that can act as strong support .
Apart from that, 161 is also the level of 50% FIB retracement of the whole rise since March 2020 . Strong stock tend to stop at that level.
Montly Chart
The above mentioned scenario would get cancelled if the stock and market turns around towards upside and the price closes above 260 for few weeks.
Keep in consideration, these are weekly/montly charts, the likely scenario would take months to play out.
Disclaimer :This post is just for learning one of the few methods of price-patterns. Views are personal. No buy/sell recommendations. These are probability study methods and chances of success/failure depend upon various factors
| Subscribe To Our Free Newsletter |
