
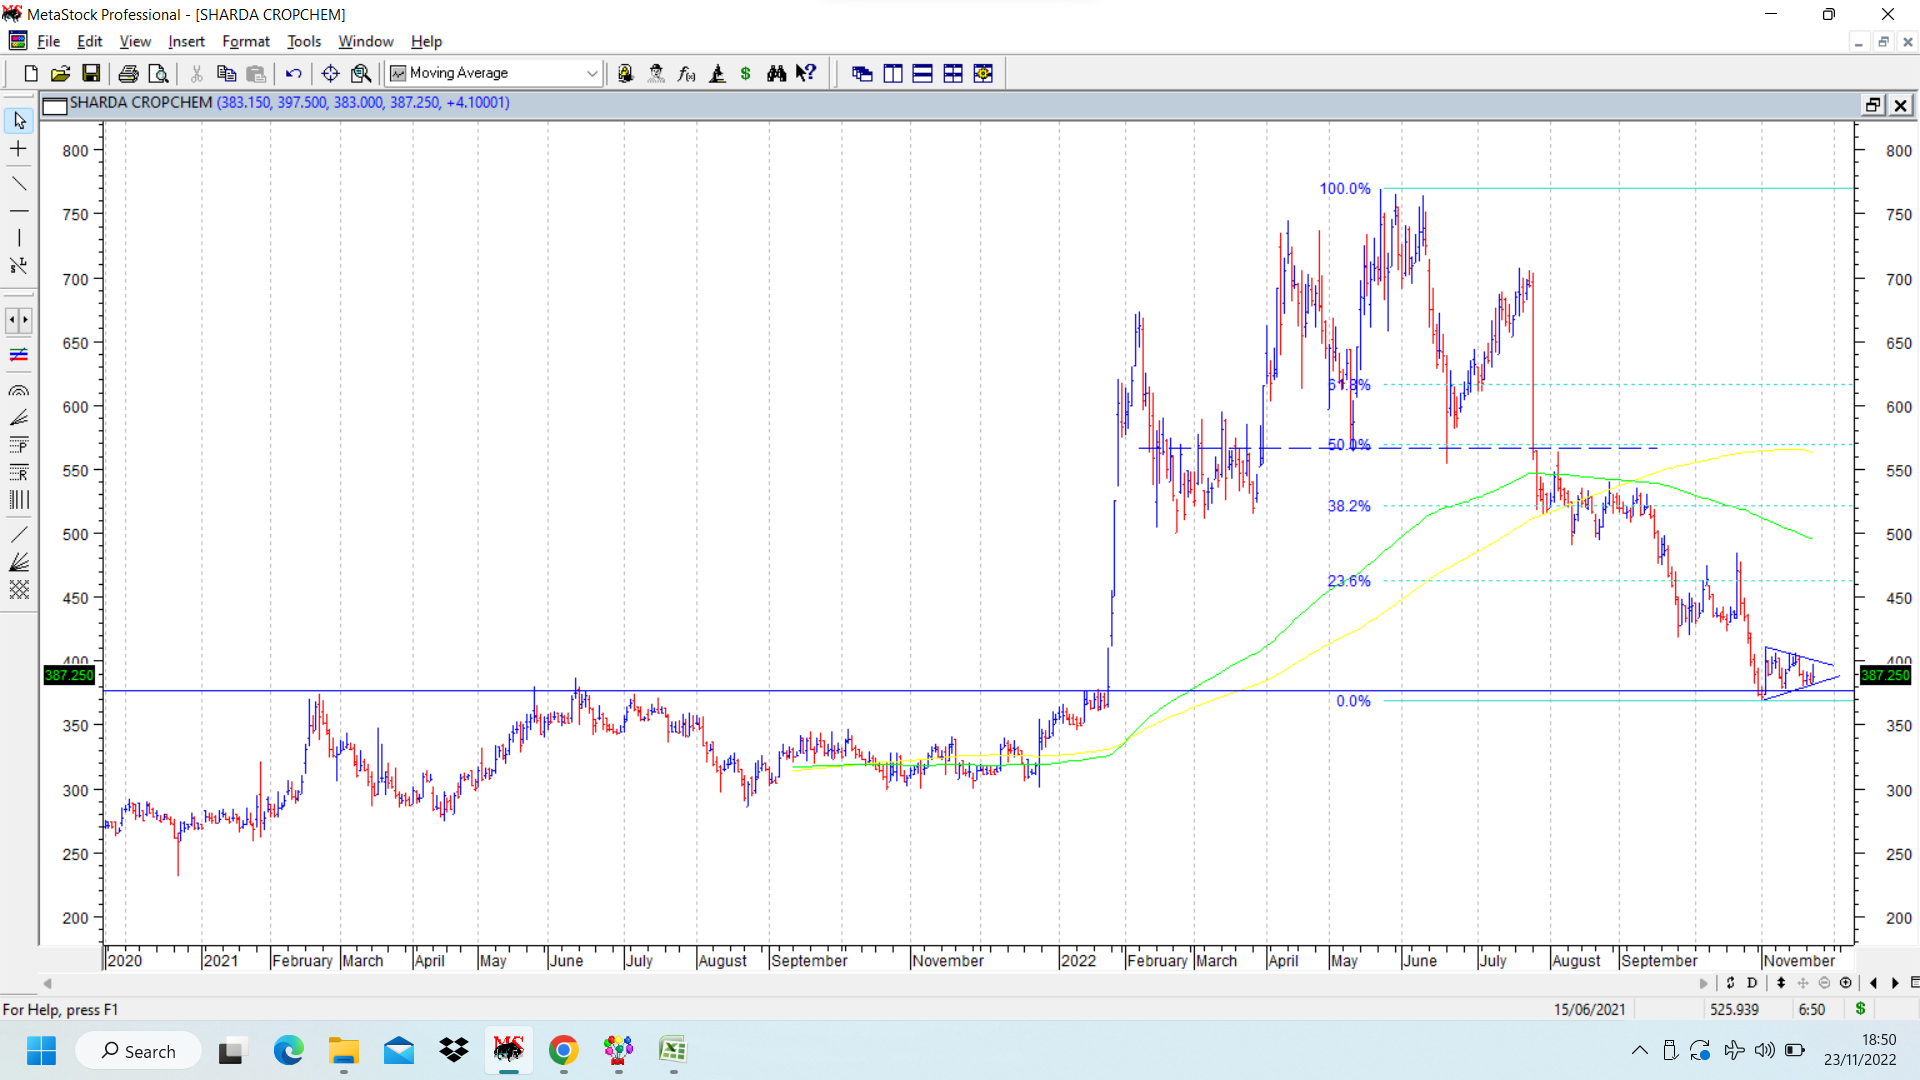
Sharda crop chart was earlier discussed because of its bearish head and shoulders breakdown (marked in dotted navy blue lines at 550-560) . Since then it has had a sharp fall and now come to crucial support levels 370-380, which was previously a major resistance in 3 instances as shown on the attached daily chart. The fall seems to be arrested as of now, and stock price is trying to consolidate in a triangular pattern. If and when it breaks out of the consolidation, above 395-400, it can provide a tradeable bounce. The resistances on the way up (if a counter trend bounce does come about) are marked on chart by putting up Fibonacci retracement levels of the fall (shown in dotted sky blue). disc: under watchlist. No positions.
| Subscribe To Our Free Newsletter |
