
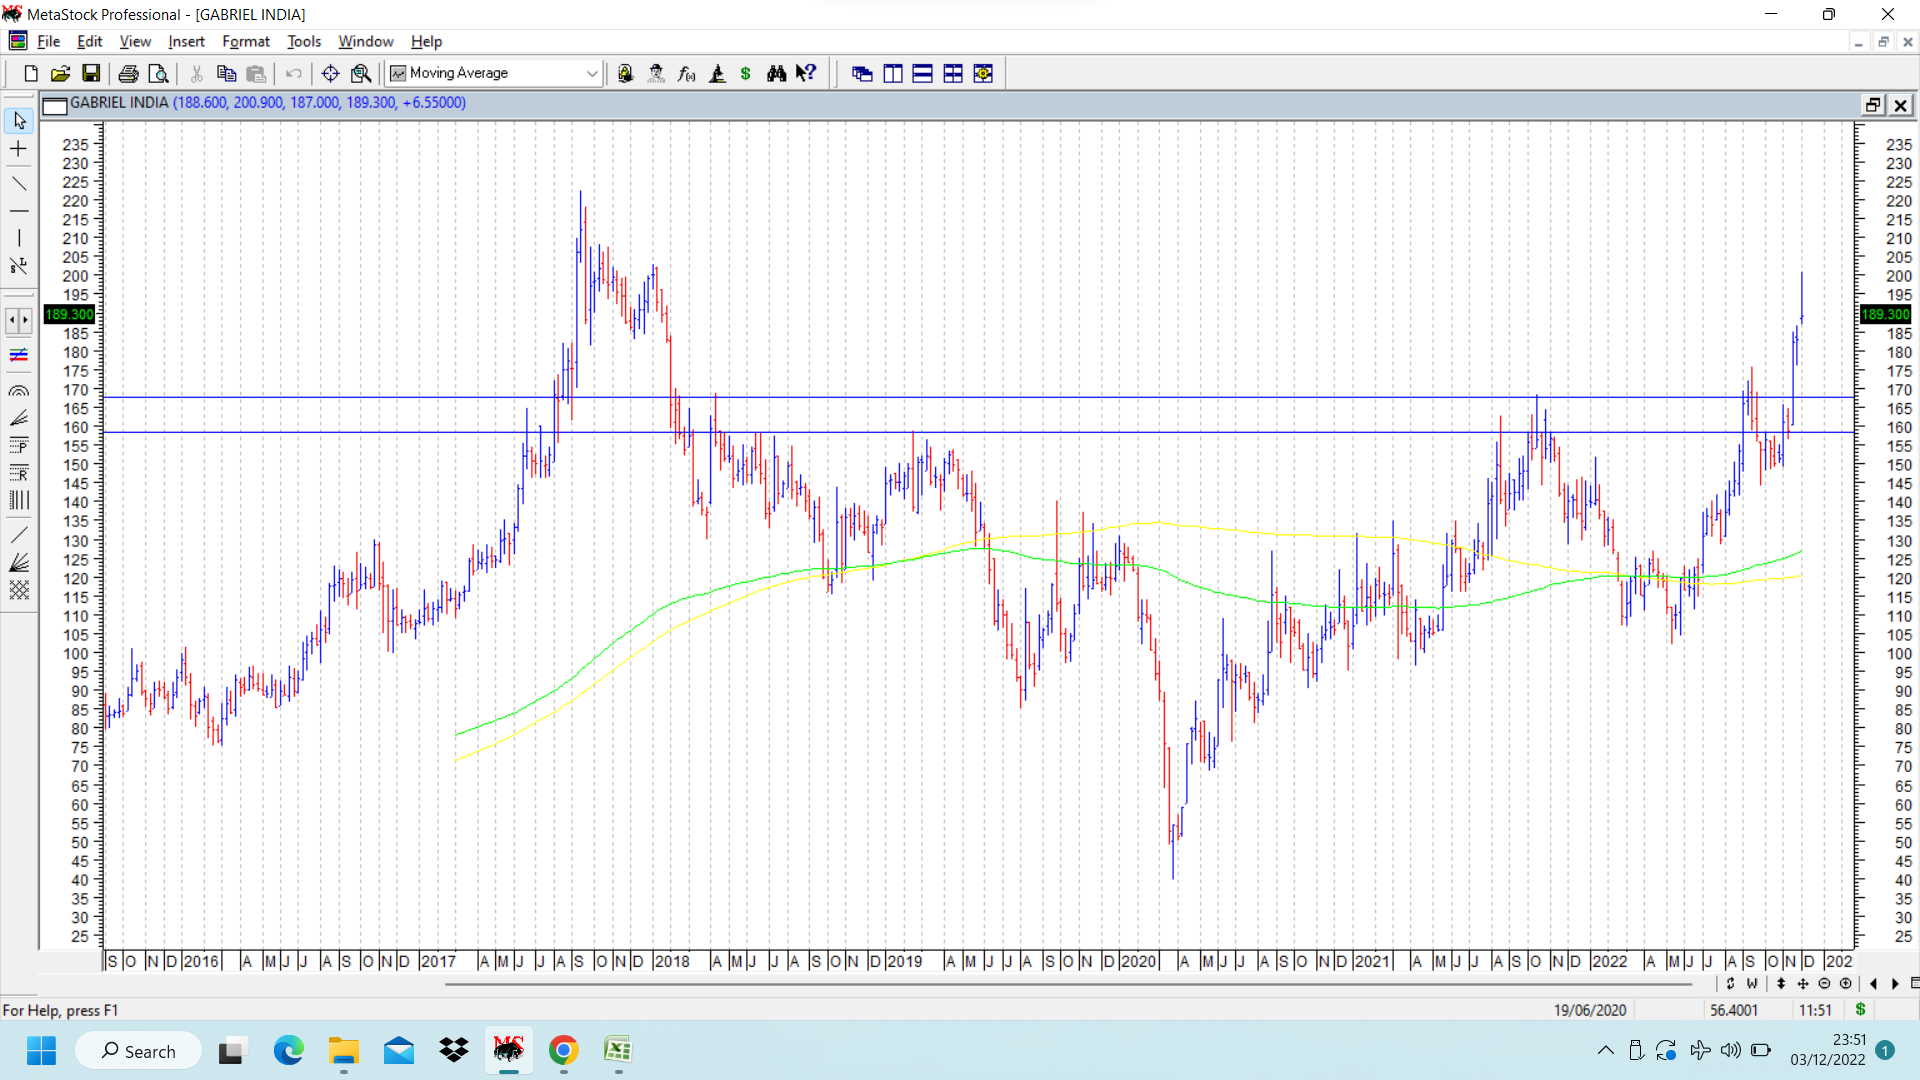
Gabriel India chart follow up. The stock chart was put up (then price of 136 in July 2022 when there was a lot of bearishness on general markets according to Elliot Wave practitioners. Since then a lot of water seems to have flown under the bridge and now markets are quoting at all time highs.) Gabriel has broken out above important resistance zone between 158-168 and hit a swing high of 200 and now seems to be consolidating. The previous resistance zone needs to be seen for possible support. All time highs on the stock charts is at 222. Last couple of quarter results have been good both on topline and bottomline front.
Weekly chart of Gabriel shows hints of an inverted head and shoulders breakout (where left shoulder is not clearly defined) . disc: booked profits and would be looking at re entry points.
| Subscribe To Our Free Newsletter |
