
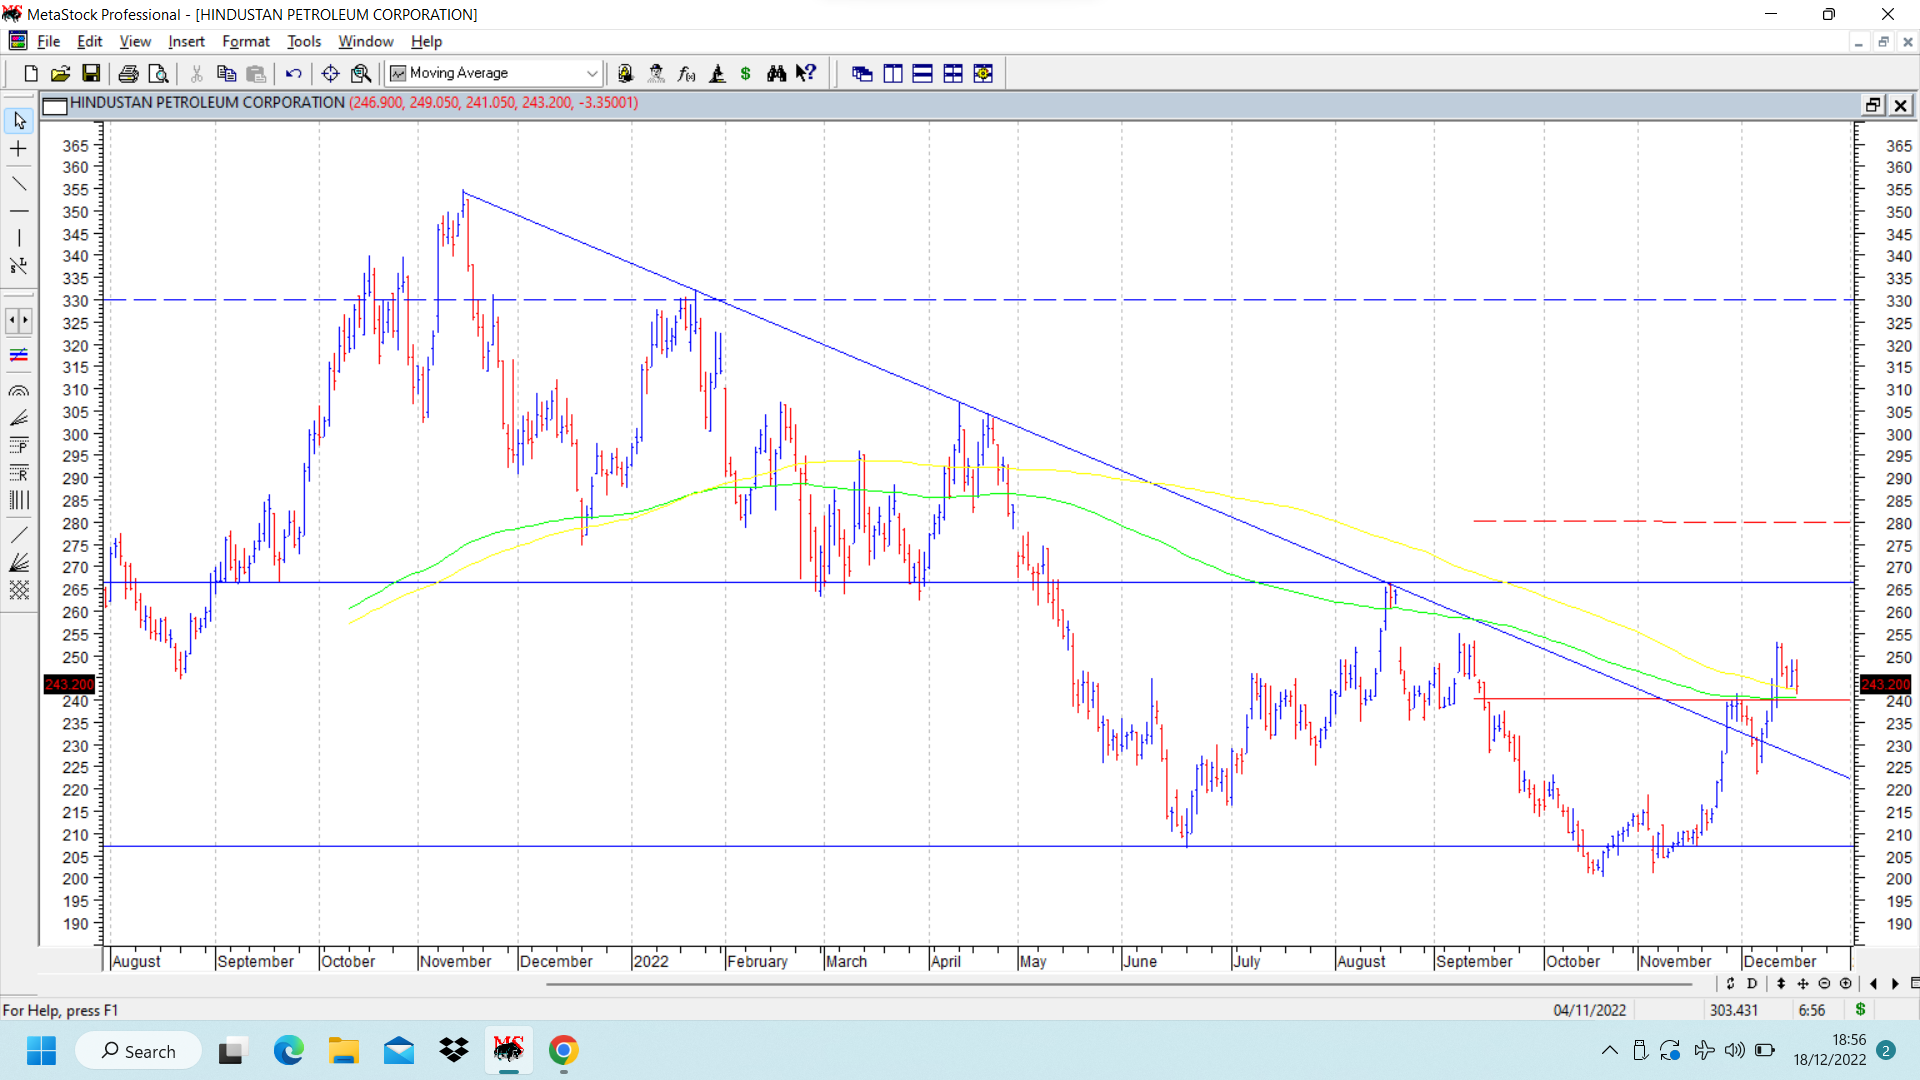
Hind Petro chart is a very interesting chart which is showing a confluence of various patterns in the same daily chart. In the chart displayed below, following technical events have happened to warrant a closer look at the stock . CMP 243.
First is a breakout from a falling trendline. Almost all the touchpoints are perfectly touching the falling trendline.
Secondly, there is a small cup and handle breakout on daily chart (marked in solid red line) above 240. Stock price briefly went above this level and now is trying to retest the breakout zone of 240 which also happens to be the value of 200 dema. If pattern plays out then target for the pattern can be 280 level (marked in dotted red line) which will cause a breakout above double bottom pattern as discussed in next paragraph.
Thirdly, there is a double bottom at levels of 200-205, and its breakout gets confirmed on a move above 265-270. If this happens successfully and pattern plays out, the stock price target based on this pattern will be 330.
I do not have any position in the stock, but for such a pattern my buying equation would be buy and accumulate at around current levels, with a stop loss of low of cup which is 223, (so to avoid any whipsaws I would prefer to keep a stop loss at around 220) and aim for sequential targets of 280 and 330. The stock remains on my watchlist.
Many a times guys new to technical analysis do not know how to take technical breakout positions with clear cut levels. Above is not a recommendation, but since the chart shows very clear levels based on patterns discussed, I have put up this chart for academic purpose.
Fundamentally the crude prices have corrected significantly of late and the marketing margins will improve a lot for these oil marketing companies. ( This has to be taken in the backdrop of fall in refining margins looking at higher priced crude inventory they might be carrying. )
| Subscribe To Our Free Newsletter |
