
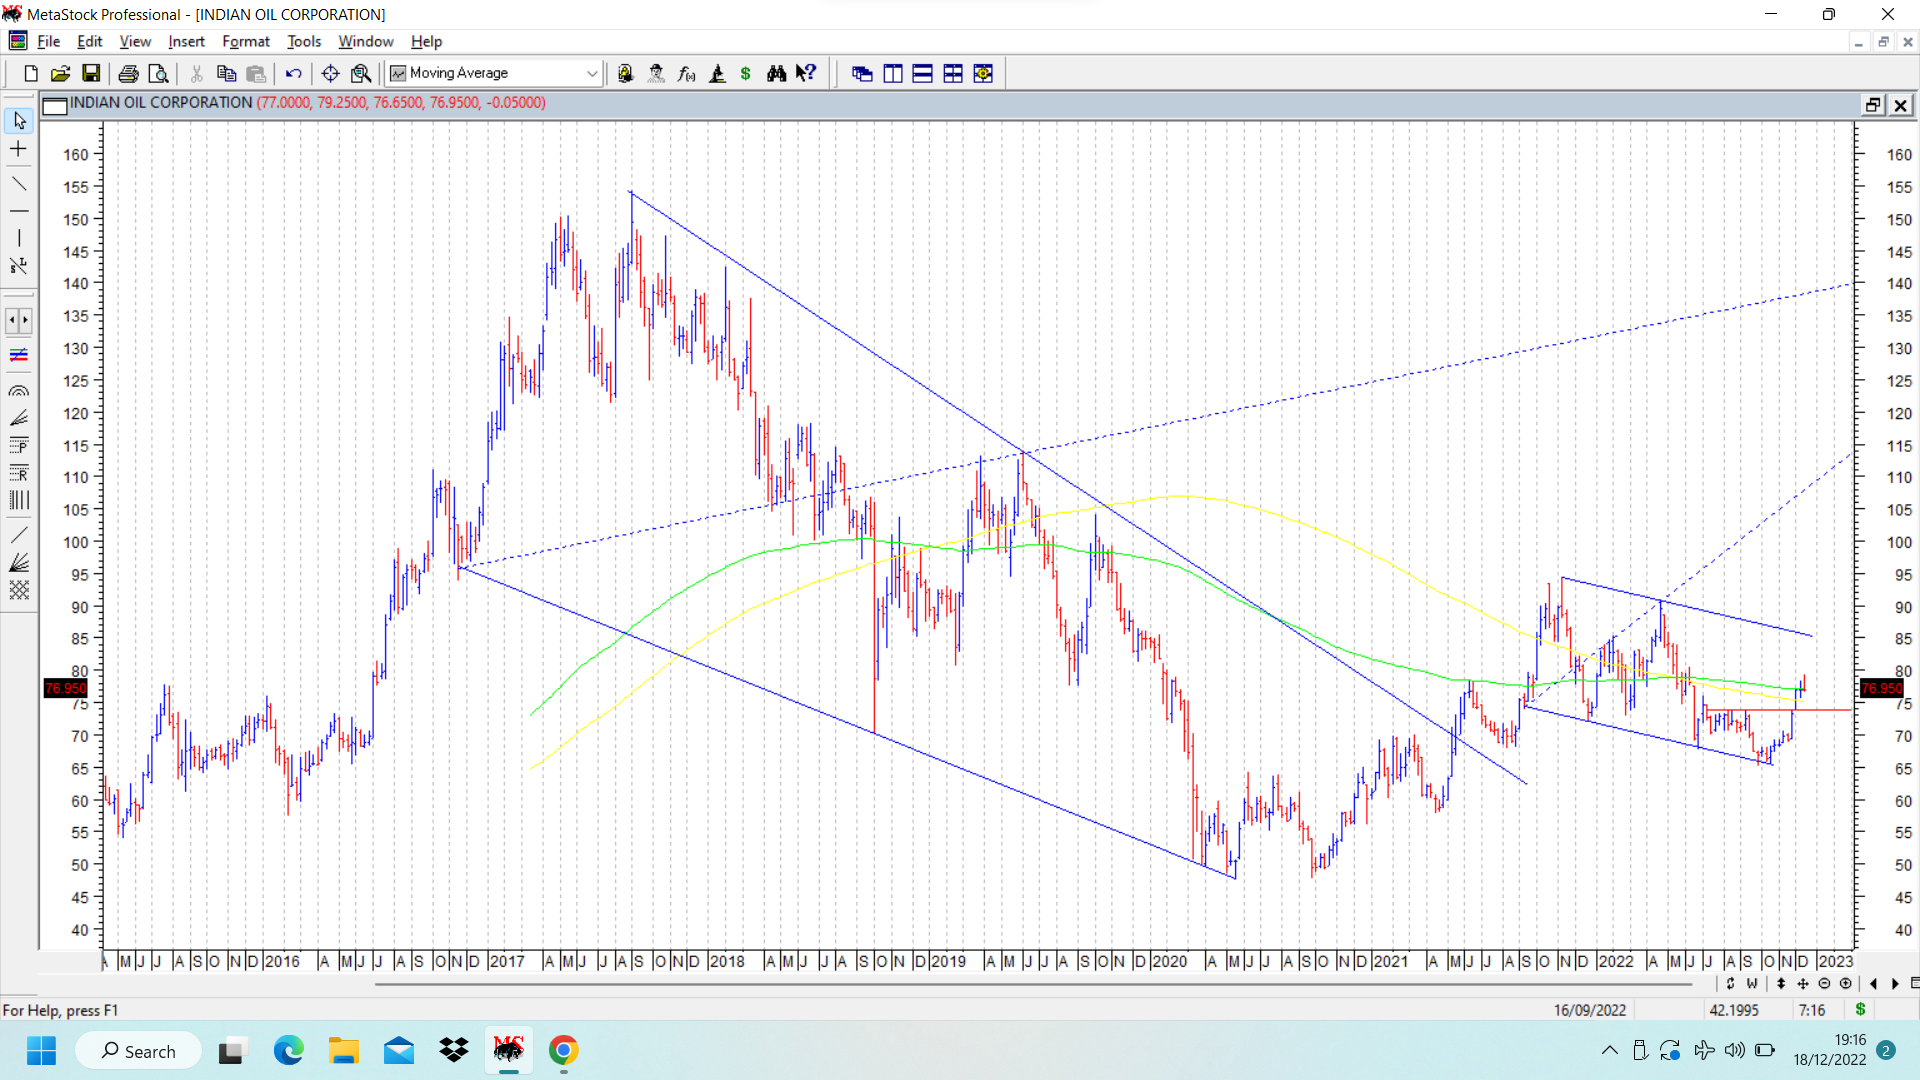
Indian Oil corporation chart put up below shows two Wolfe Waves, one on longer term time frame and the other on right, on shorter term time frame, both depicted on weekly charts.
cmp 77. An important level market on chart is that of 74, which previously acted as a strong resistance as shown by horizontal red line. Recently stock price crossed that level, and has been consolidating above that level. We need to watch out for support levels of 74 and below that, 70. 200 dema is also placed at 73.55 and moving up.
On the two weekly Wolfe Wave patterns marked on chart, targets are 115 and 140, which I am looking out for sequential targets in the chart. disc: invested as a techno funda bet. (Funda logic is simple, based on fall in international crude prices, which could lead to improvement in marketing margins, though affect refining margins)
| Subscribe To Our Free Newsletter |
