
DeePak Nitrite
CMP 2050
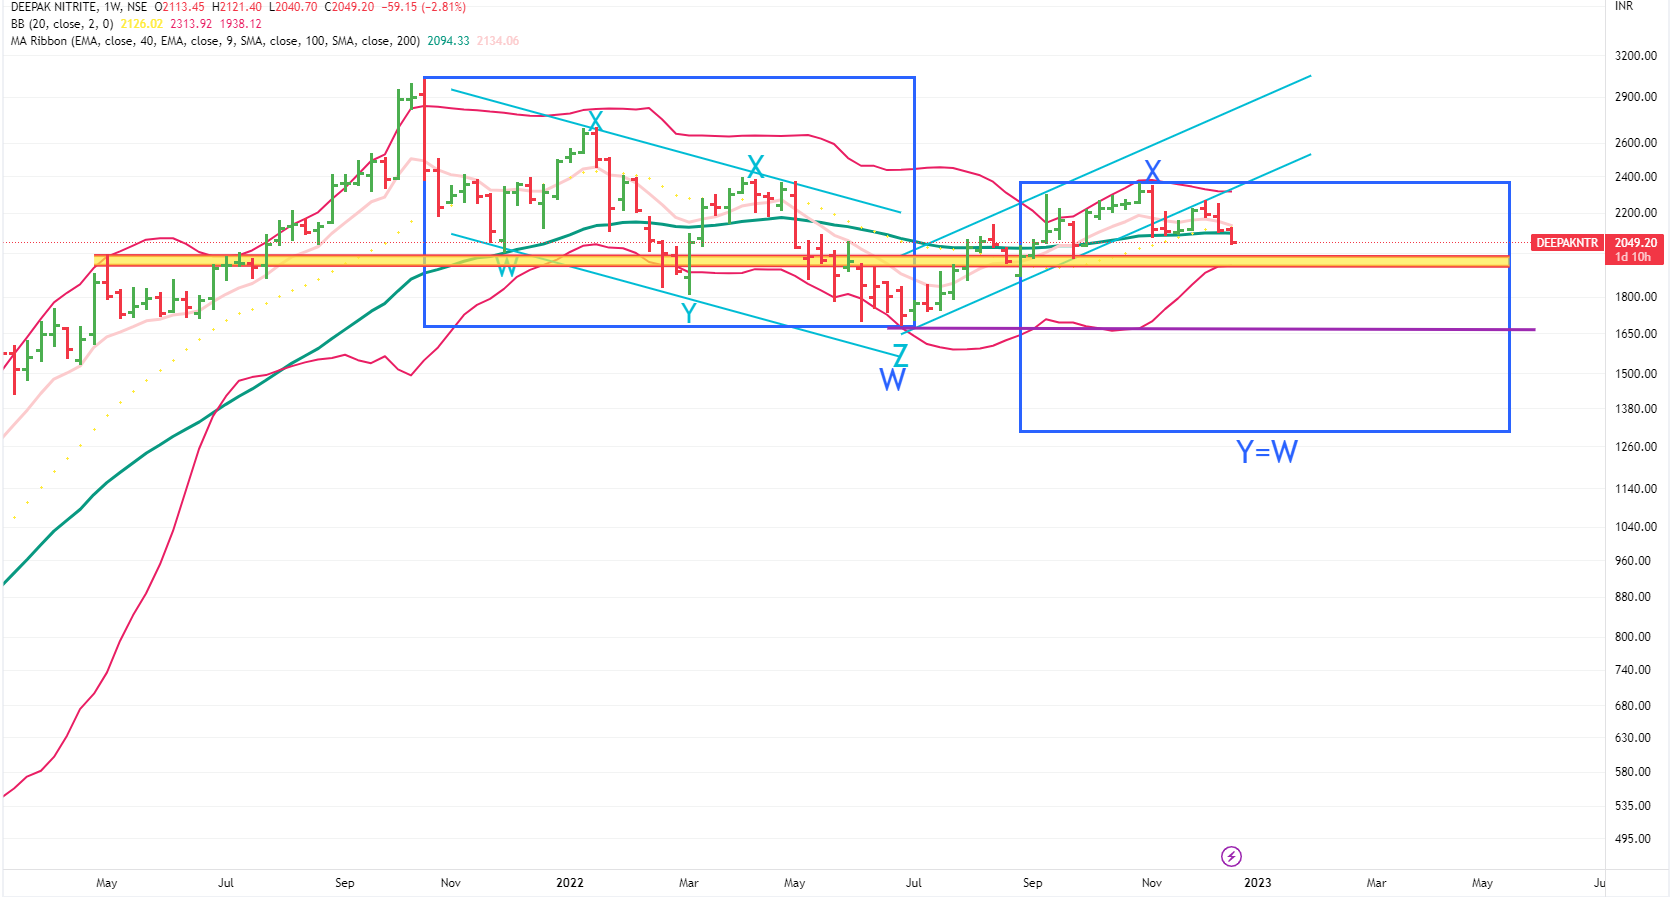
It seems that it has entered Stage 4- has broken 40 WEMA very convincingly but let’s wait for the close below it on weekend ( expecting a small bounce in very short term)
Daily.Weekly,Monthly -All MACD is sell zones and <60 RSI signifies the weakness in the chart.
Next support levels are in yellow -zone ie between 1988-1940 (lower end of weekly BB).
Once that breaks, it might go to June lows of 1681. After that 40MMA can be the support ie near 1580 as of now.
And if the market sentiments remain week, we might achieve Y=W.
In short, lot of levels to track.
Weekly Chart
Keep in consideration that it is a weekly chart. It might take weeks and months for the projections to play out (if they play out)
Disclaimer :This post is just for learning few methods of price-patterns. Views are personal. No buy/sell recommendations. These are probability study methods and chances of success/failure depend upon various factors
| Subscribe To Our Free Newsletter |
