
Tata Motors
CMP -403
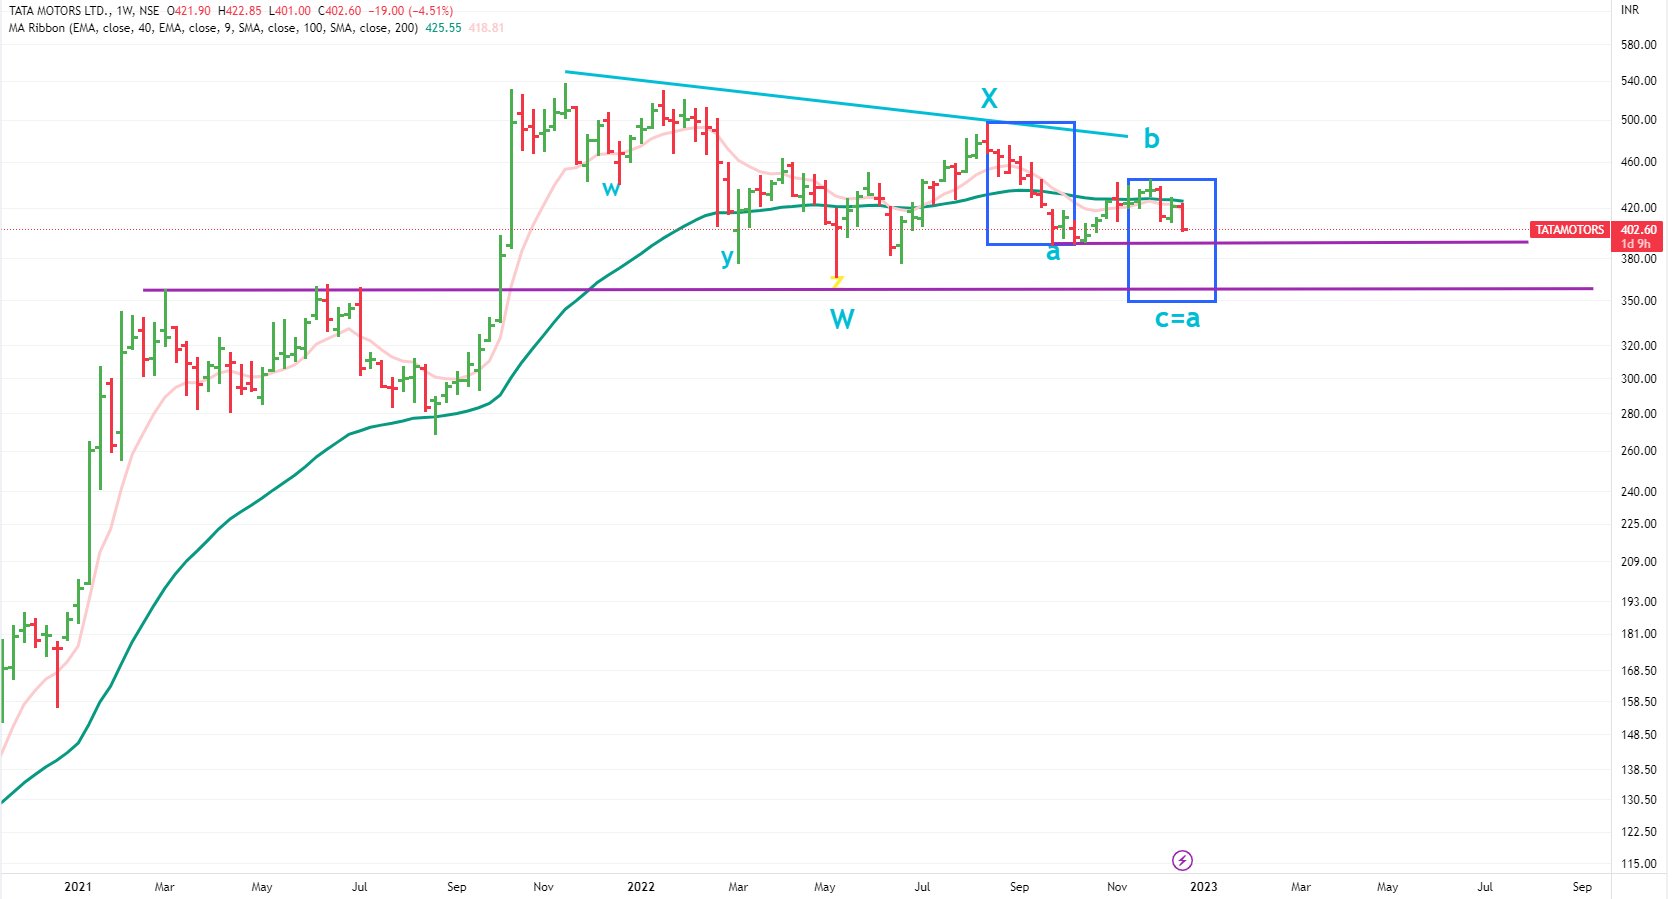
It seems that it has entered Stage 4- has broken 40 WEMA very convincingly but let’s wait for the close below it on weekend ( expecting a small bounce in very very short term)
Daily.Weekly,Monthly -All MACD is sell zones and <60 RSI signifies the weakness in the chart.
If it goes on the projected journey as shown in the chart ,the following are the stop/support points and these need to be broken going forward :
a) 391 -October lows
b) 381-Lower weekly BB
c)366 -May low
d) C=A and that also coincides with 40 MMA.
And this possibility remains till it does not cross 428 on upside. If it crosses the same, time to review again.
Weekly Chart
Keep in consideration that it is a weekly chart. It might take weeks and months for the projections to play out (if they play out)
Disclaimer :This post is just for learning few methods of price-patterns. Views are personal. No buy/sell recommendations. These are probability study methods and chances of success/failure depend upon various factors
| Subscribe To Our Free Newsletter |
