
Nasdaq & FAANG Stocks
FAANG stocks have been the leaders in last few years rally in USA .
With 13 years bull run ending in tech-stocks,while all other FAANG stocks have corrected significantly, APPLE was holding its fort.
Nasdaq -Quarterly Chart
13 years bull run trend line is about to break.
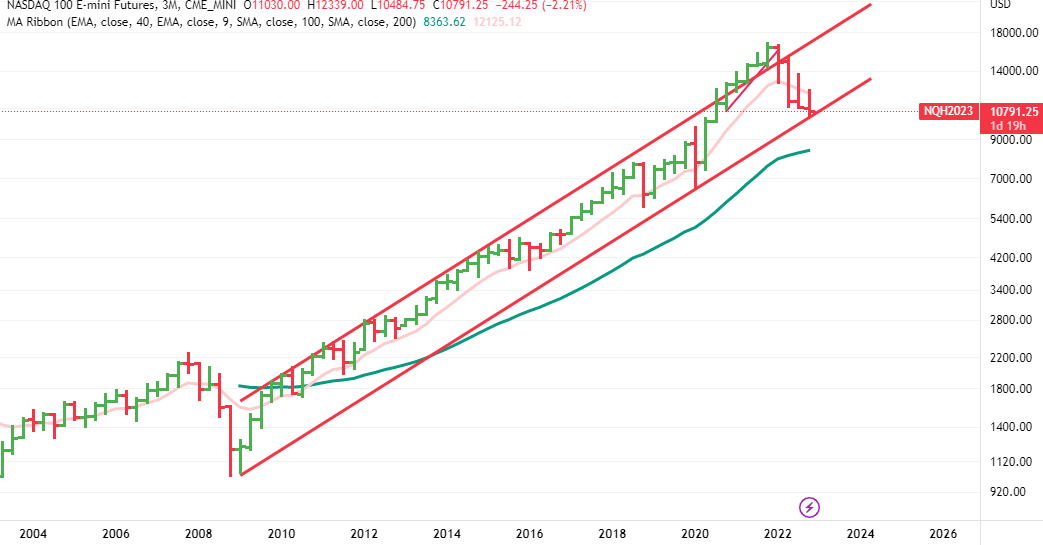
But now we can see the cracks .Is it the turn for APPLE now ?

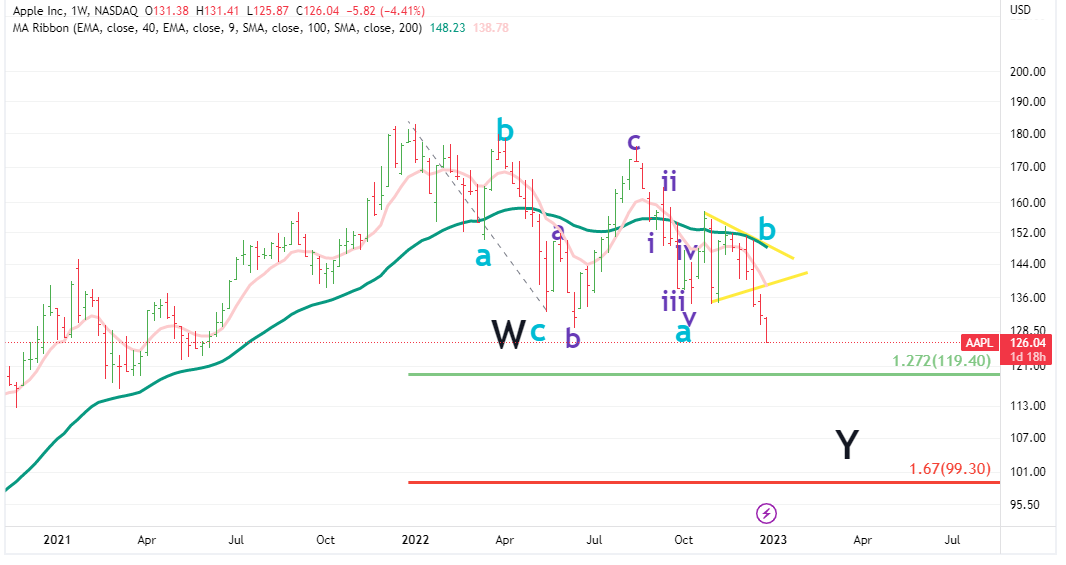
Apple
CMP 126
It has broken its October lows and there is not nearby support is visible.And it is already in S4 stage for months.
As per the weekly chart and EW ,next level can be 119 and if it does not stop there, we can see 100 on the tape.
Weekly Chart
Keep in consideration that weekly chart projection takes weeks/months to play out.
Let’s keep a track.
Disclaimer :This post is just for learning few methods of price-patterns. Views are personal. No buy/sell recommendations. These are probability study methods and chances of success/failure depend upon various factors.
| Subscribe To Our Free Newsletter |
