
I am also personally very interested in low volatility portfolios. So ran a backtest based on following method.
- Measure the volatility of prev year.
- Measure DD from high within last three years.
- Calculate z scores of both the criteria.
- Calculate total z-score, by 75% weightage to Low volatility and 25% to minimum drawdown from three year high.
- Rank the stocks with least scores. Filter the stocks which trades at least 99% of total trading days.
- Shortlist top 20 stocks. Form equal weight portfolio.
- Rebalance monthly.
Other parameters
- Direct Taxes:- 10% of yearly profit
- Brokerage/transaction costs:- 0.275%
- Cash Component:- 5% of total portfolio.
- Initial Capital:- 11 lacs
- Dividends:- not considered
Equity Curve
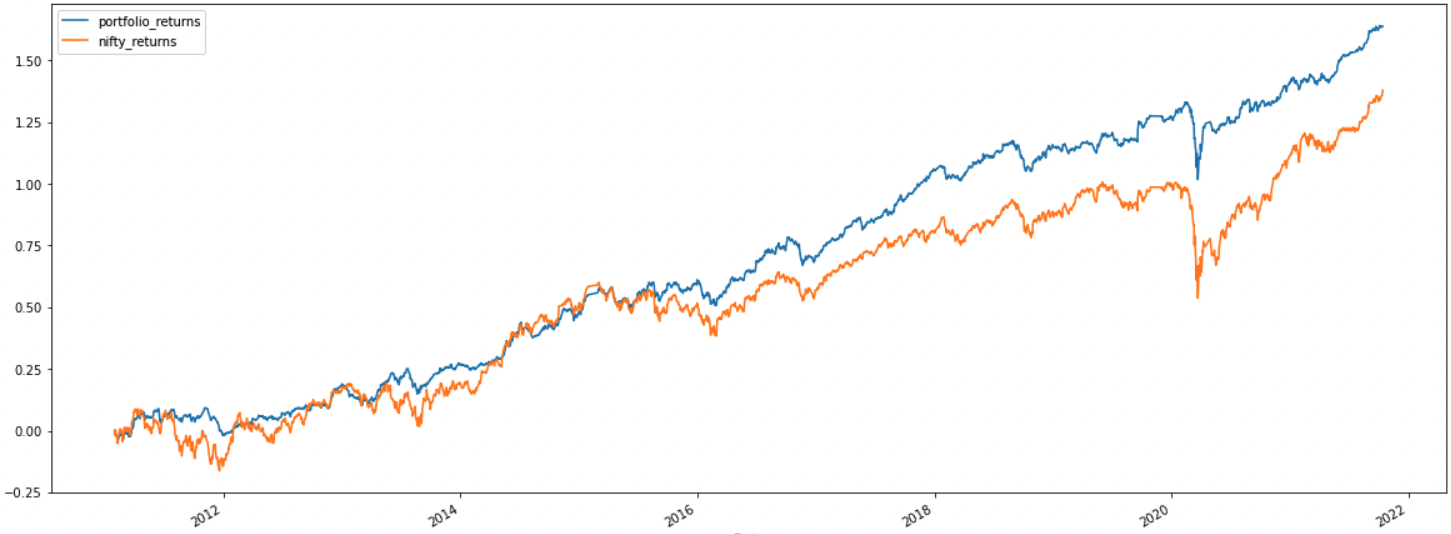
Backtest Period:- Jan 2011 to Oct 2021
Benchmark:- Nifty 50
CAGR:- 12.75%
Annual Volatility:- 11.01%
Beta:- 0.47
Sharpe Ratio:- 1.37
Omega Ratio:- 1.29
Sortino Ratio:- 1.92
Max Drawdown:- 27.98%
Disclaimer:-
This is not an investment advice. The above data has represented for study purpose only. I am not SEBI approved investment advisor.
The above data is prone to calculation mistakes, inaccurate data etc.
| Subscribe To Our Free Newsletter |
