
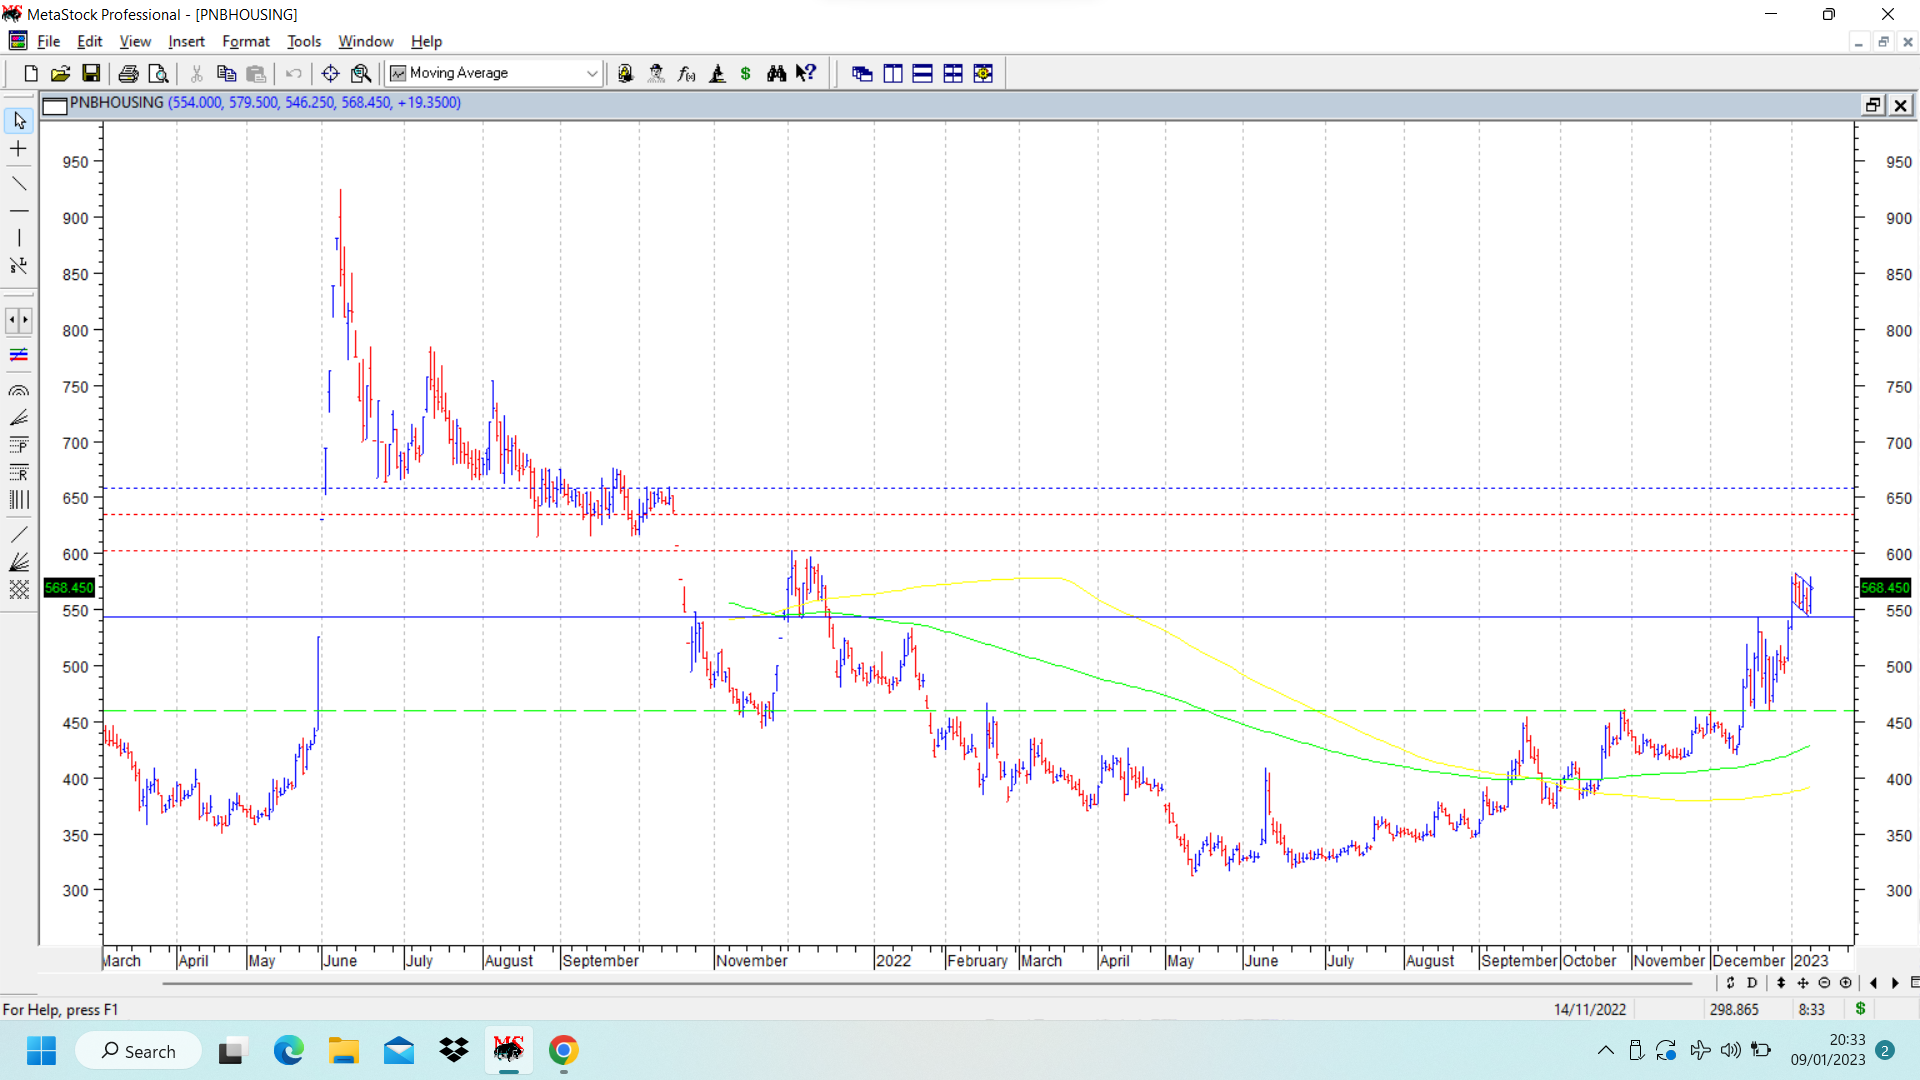
I had earlier posted a chart of GIC housing. Putting up chart of PNB Housing finance. cmp 568. This is a very interesting chart to learn how to spot and benefit from recognising early stage of a rounding bottom formation. In the past this kind of chart has been seen in Pricol, Usha Martin etc.
In case of PNB Housing, in the daily chart attached, the fall began from a swing high of 925, and stock price went down to a low of 315. The last part of the fall from 460 to 315, marked below dotted green lines was left half of the rounding bottom. We do not want to catch stock at absolute bottom.
But once the stock bottomed out and started moving up in a gradual rounding pattern, it crossed important pivots joined by green dotted lines which were intermediate peaks at 460. The rounding bottom formation early phase was visible to the practiced eye. Another important aspect of this kind of formation is that stock price tends to go above 200 dema and and slope of 200 dema also starts moving up. ( one can use 30 week moving average on weekly chart and get near same picture) The whole chart is punctuated by higher tops and higher bottoms in a rounding formation. The stock price starts crossing 1 year high, 2 year high and so on. Usually the target to aim for is the beginning of the rounding bottom formation, which in this case is 925. (looks far fetched as of now, but can happen as seen from previous examples of stocks like pricol) Many a times pattern fails and we have to cut our losses, or book premature profits and move out. (this is usually something that guys following technical analysis have to learn and respect. there is no place for ego.)
In recent past, stock price hit a swing high of 533 which was 52 weeks high at that time and immediately cooled off to retest the pivot zone of 460 and took support in form of consolidation above it. On 2 Jan 2023, it went above the swing high and posted another swing high of 583 and seems to be forming a flag like consolidation. If breakout from flag happens and pattern targets are achieved, it can reach 658 marked in dotted blue lines. The region marked in dotted red lines between 602-634 is a potential resistance on the way up as it is an unfilled falling gap. Such a large gap needs a huge upmove with big volumes to overcome strong resistance. If and when happens is anybody’s guess.
Two important things here is discount to book value, and similar strength seen in comparable peers like Gic housing finance and to a lesser extent in repco home finance. disc: invested in both pnb hf and gic hf as techno funda bets with strict stop losses.
The main aim of sharing this chart is to try and learn to pick up early stage rounding bottom formations to get entry points where risk reward equation is extremely favourable. There will be plenty of examples for someone who wants to look at scores of charts. We are looking at a live example here and would like to follow through on how things pan out.
| Subscribe To Our Free Newsletter |
