
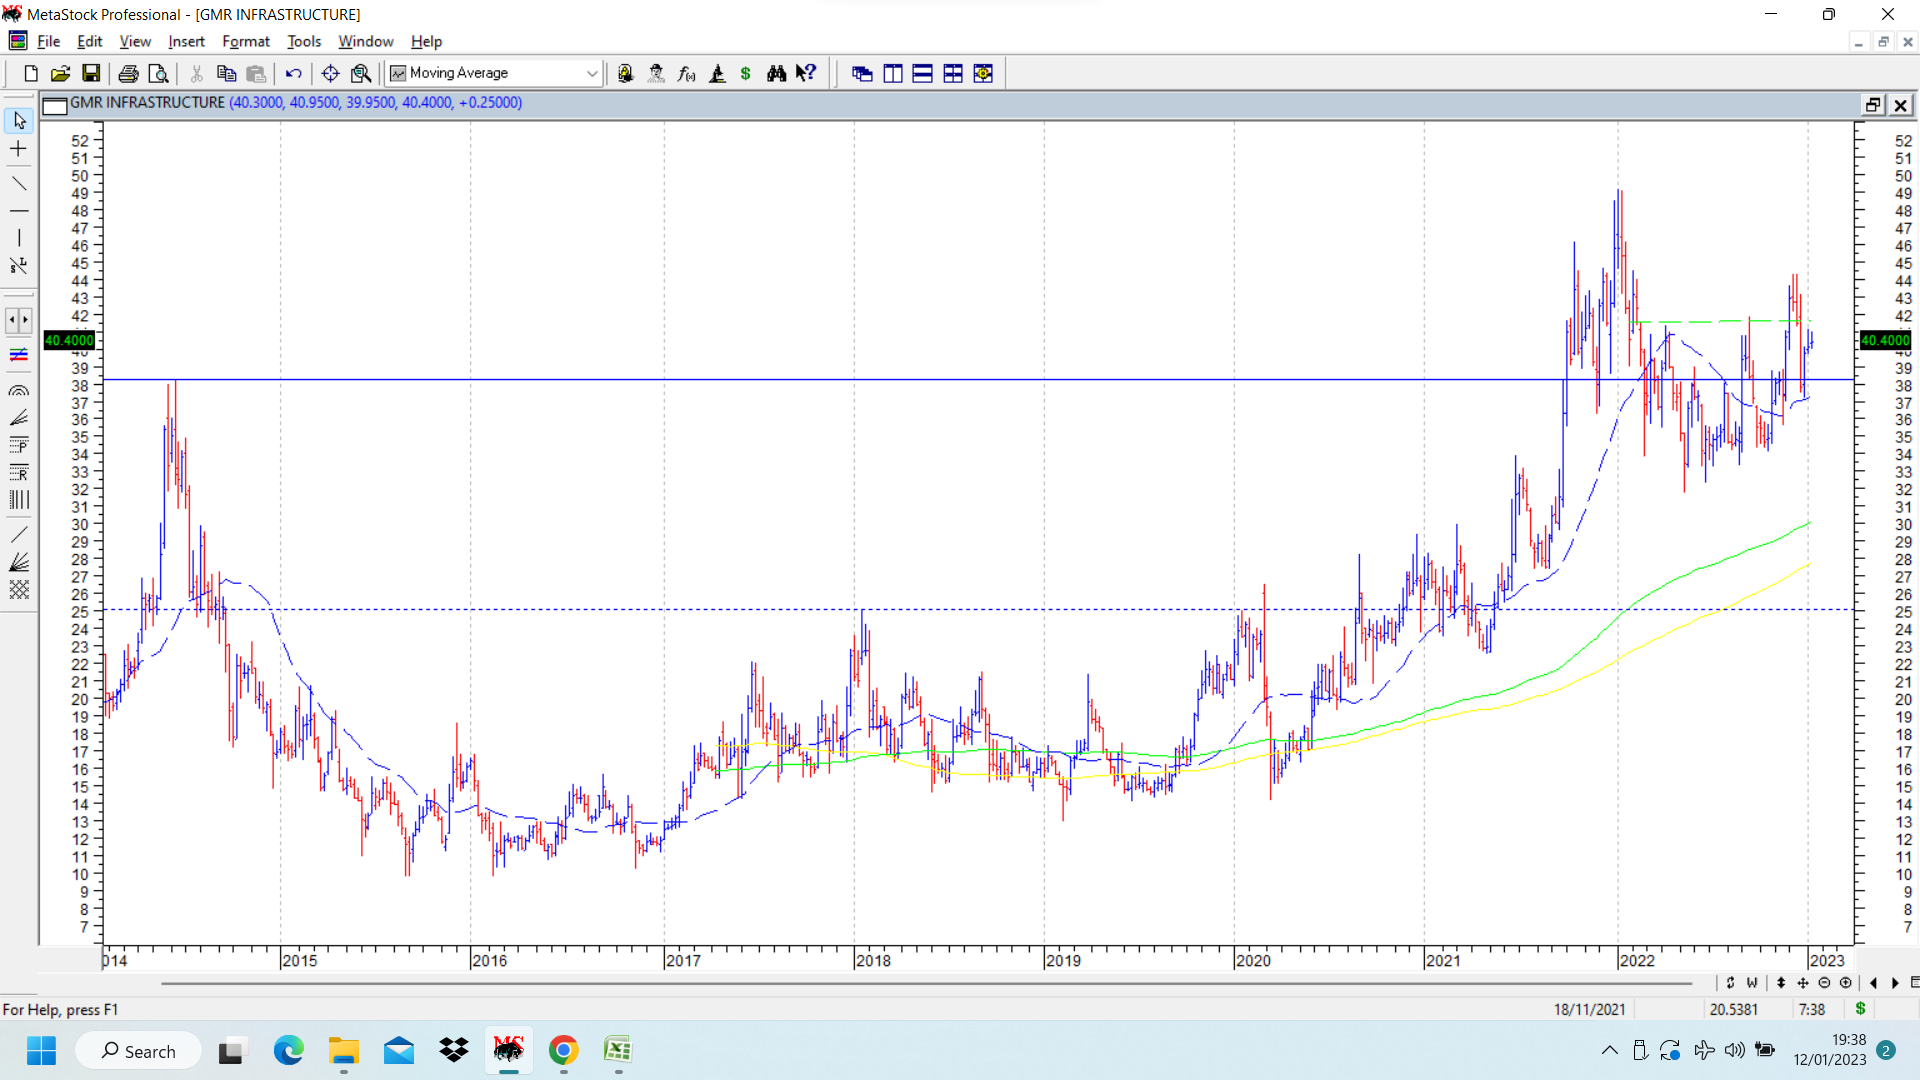
GMR Infra stock price broke out above 8 year high of 38 in Oct 2021 and went on to hit a swing high of 49, before correcting with the overall markets. It went down and hit a swing bottom of 32, before resuming uptrend.
Some interesting observations:
Early stage rounding bottom was visible at price of 25 when it crossed important pivot resistances marked in dotted blue horizontal line. The wavy dotted blue line represents the 30 WEMA which is used for purpose of stage investing had turned up then. The whole rise from levels of 12 to 38 was in form of a rounding bottom.
Subsequently stock price went up to 49 and corrected to 32, nearly 30% correction from top. The 30 WEMA had turned down briefly but once the uptrend resumed, it also has started moving up and now is placed at 37.
The weekly chart on extreme right also shows a rounding formation below small dotted green line which is placed at 42 on bar chart and on line chart the resistance is at 40. Stock price has shown some resilience in the recent market correction.
disc: invested as a technical bet.
| Subscribe To Our Free Newsletter |
