
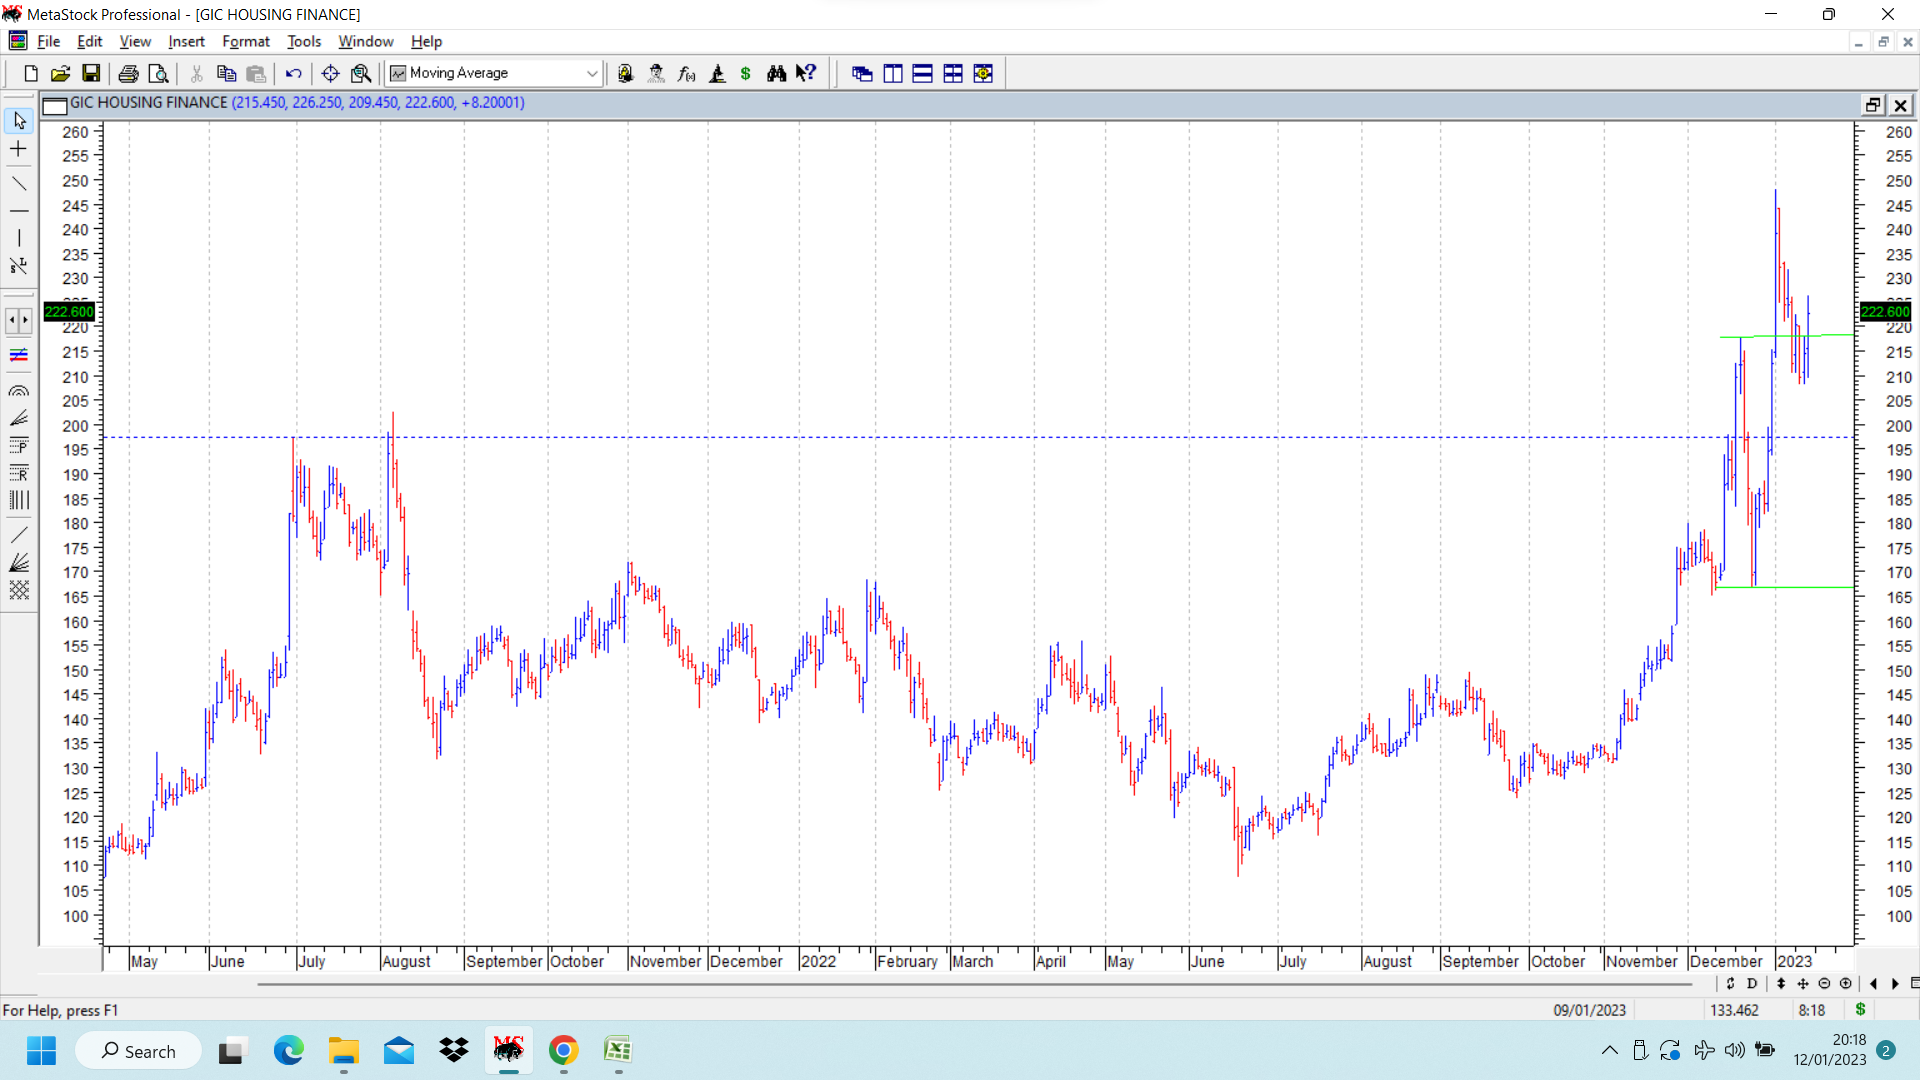
GIC Housing chart update. As shown in chart, stock price broke out above 52 weeks high above 202 as mentioned in a previous post. After that stock price hit a swing high of 217.80 and promptly corrected to 166. Here it formed a double bottom and stock price resumed uptrend to post another swing high of 248, before again correcting with overall markets and posted swing low at 208. This was a retest of breakout zone and as often happens, stock price tends to go slightly below exact levels. After a few days of range bound moves, stock price today again broke out above congestion zone and closed above 220. Target of double bottom pattern (enclosed in green horizontal parallel lines) could be close to 265-270. Housing finance companies like GIC hsg and PNB Hsg have been showing good relative strength in an overall weak market.
| Subscribe To Our Free Newsletter |
