
Alembic Pharma , Lux Industries
Both the stocks chosen by you are showing similar signs:
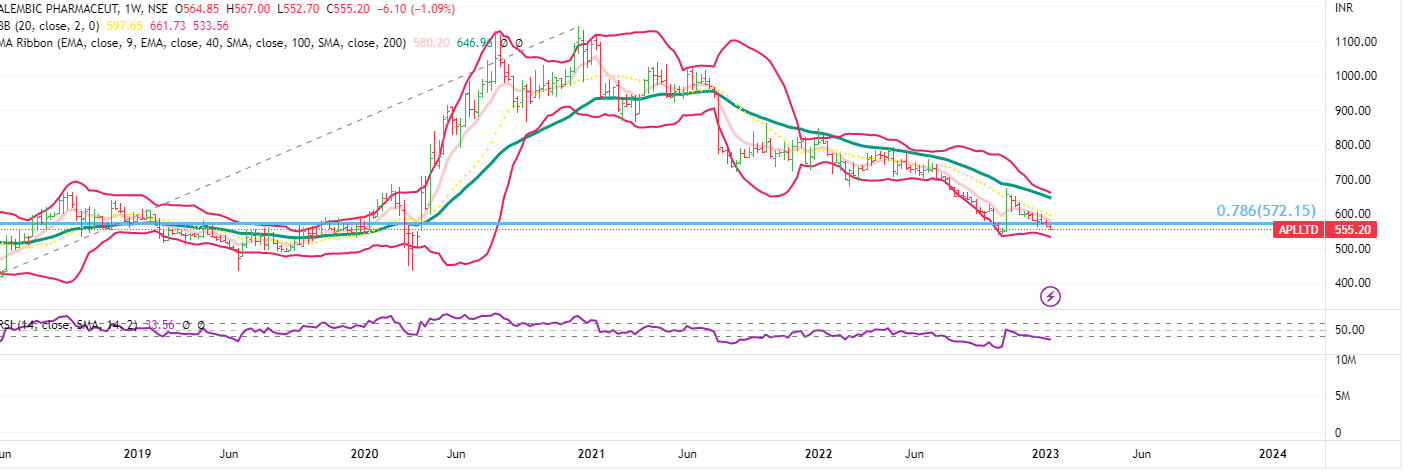
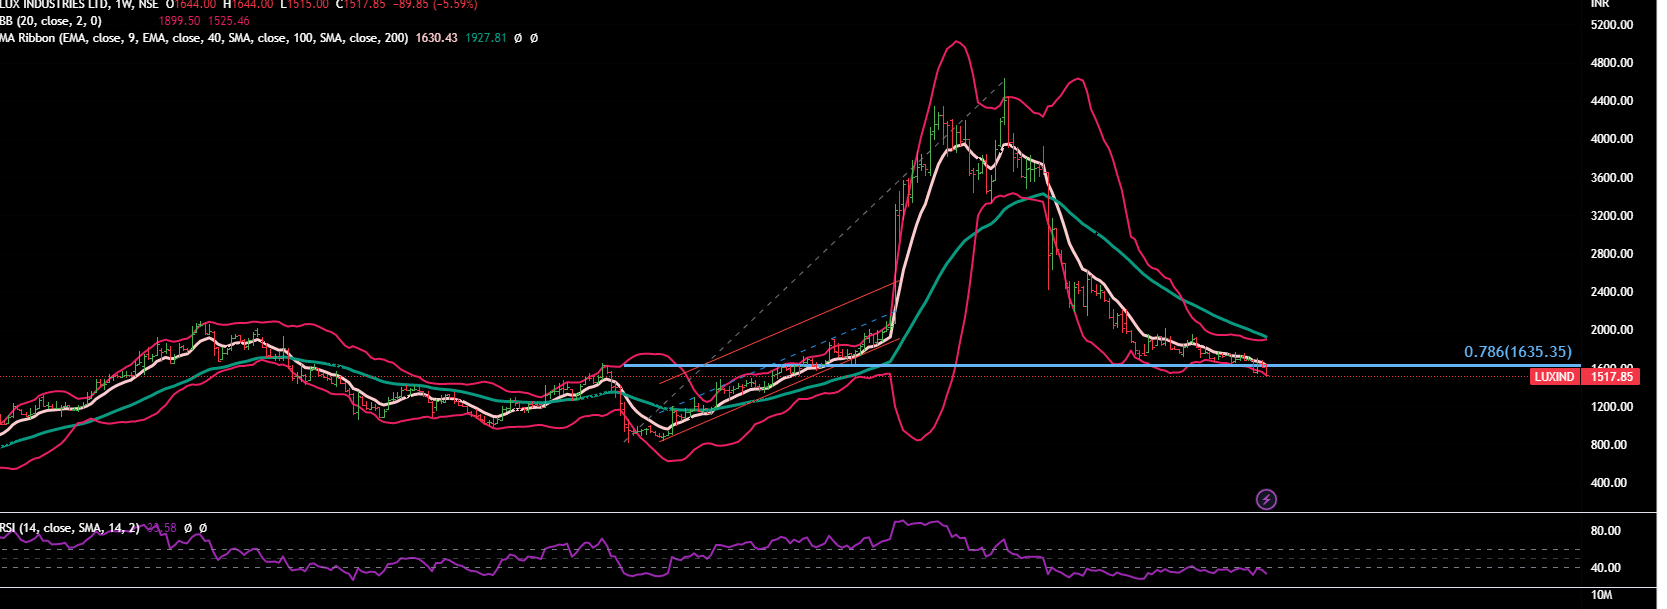
a) Both have retraced close 80% of their last leg of rally- they may be near to their bottoms
b) Both are retatively weaker wrt iither stocks of their own sectors as well as in context of index- a sign of great weakness.
c) There seems to be small divergence on RSI . That means they’re cose to bottom.
d) In case of Alembic pharma,keep a watch at 542 (recent low), if it breaks that then it can go more lower.
e) For any upside ride, we would first wait that these first close above 20 WMA as well as let dialy and weekly MACD give buy signal. We would increase out position size we if keep geeting positive signals like closing above 20 DMA, 40 DMA, 20 WMA,40 WMA , MACD buy signals on different time-frames etc etc.
Alembic Pharma-Weekly Chart
Lux Industries -Weekly Chart
We can’t predict anything on long term as we don’t track the fundamentals of these companies. But looking at charts, deep corrections – it seems that something is wrong.
Disclaimer :This post is just for learning few methods of price-patterns. Views are personal. No buy/sell recommendations. These are probability study methods and chances of success/failure depend upon various factors.
| Subscribe To Our Free Newsletter |
