
Manappuram Finance
CMP 121.65
Lot of things mentioned about Muthoot Fin in the above post also apply to this stock. although chart is little different .
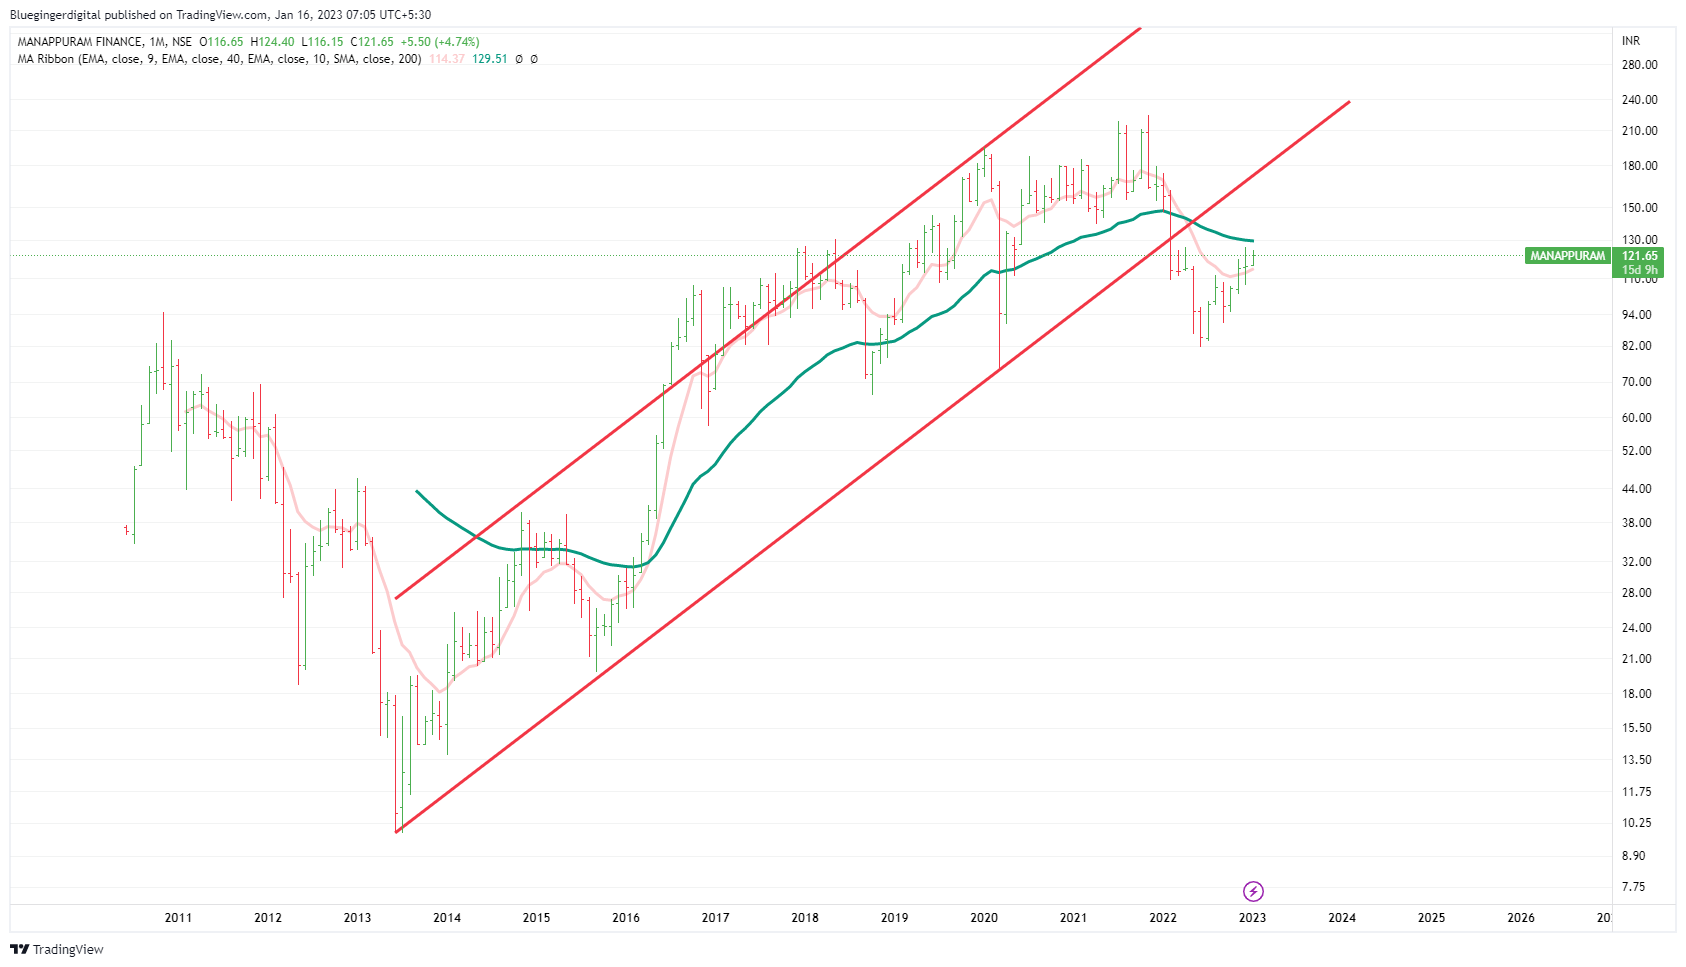
Monthly Chart
It broke the long term channel long back and is still below 40 % below its ATH.
It is still below 40 WMA moving average.
In last few months , it trying to move up and has recovered a bit.
On weekly charts, it looks better than Muthoot as it is trading above 40 WMA. It is in buy zone on all time frame from MACD prespective but we will not rush (technical reason given below)
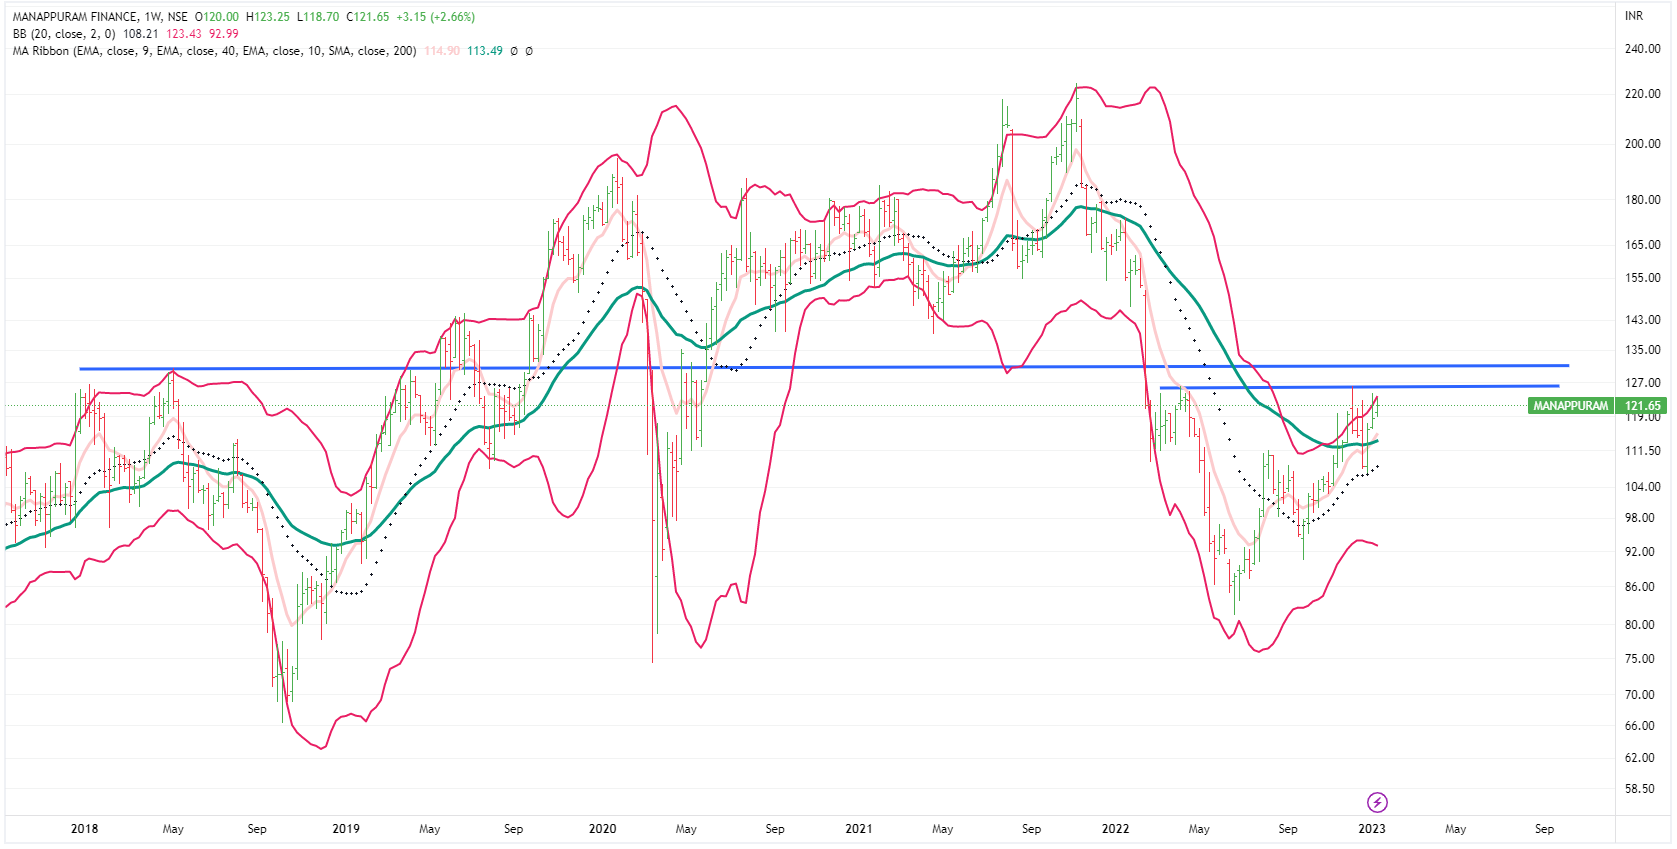
Strong Resistance Ahead
a) It is yet to cross the trading zone on weekly chart – it has strong resistance in the range of 126-133.
b) On monthly chart,40 MMA and 20 MMA may also act like resitances – that is the range of 130-135 .
So unless the stock does not cross 135 level with volume and close above these levels on month-end, we won’t look at this for long term investment.
Disclaimer :This post is just for learning few methods of price-patterns. Views are personal. No buy/sell recommendations. These are probability study methods and chances of success/failure depend upon various factors.
| Subscribe To Our Free Newsletter |
