
Muthoot Finance
CMP 1062
Although gold has crossed its all time high (ATH), Muthoot finance is 30% lower than its ATH.
Is that a hint that there is no longer a direct correlartion with gold prices . May be it is due to competition from other NBFCs and Banks in this sector due to high OPMs of the past.
Loans against gold are the most secure ones , so every loan-giving company would like to enter in this field.
Let’s look at the charts .
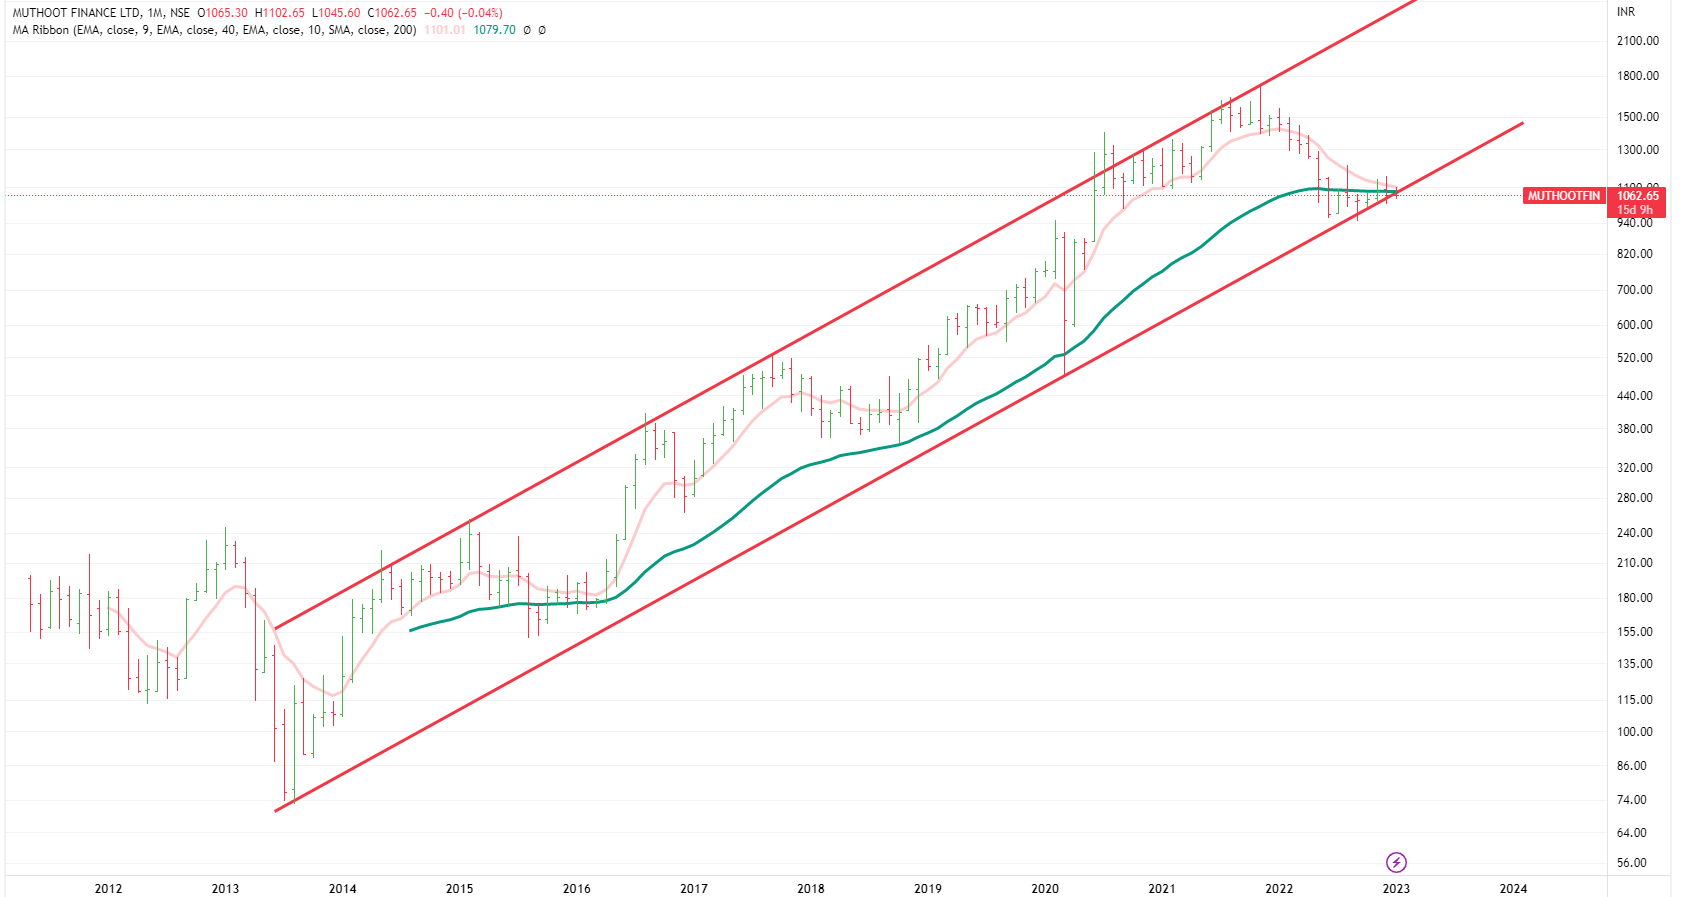
Long term Monthly Chart
It is at the lower end of its long term channel (9 years ) and is below its 40 MMA.
Generally stocks having a good future- growth trajectory tend to bounce back from these lower-end of these longer term channels.
But here we need to wait as it is lingering there for last 405 months.
How to judge whether it is turning around ?
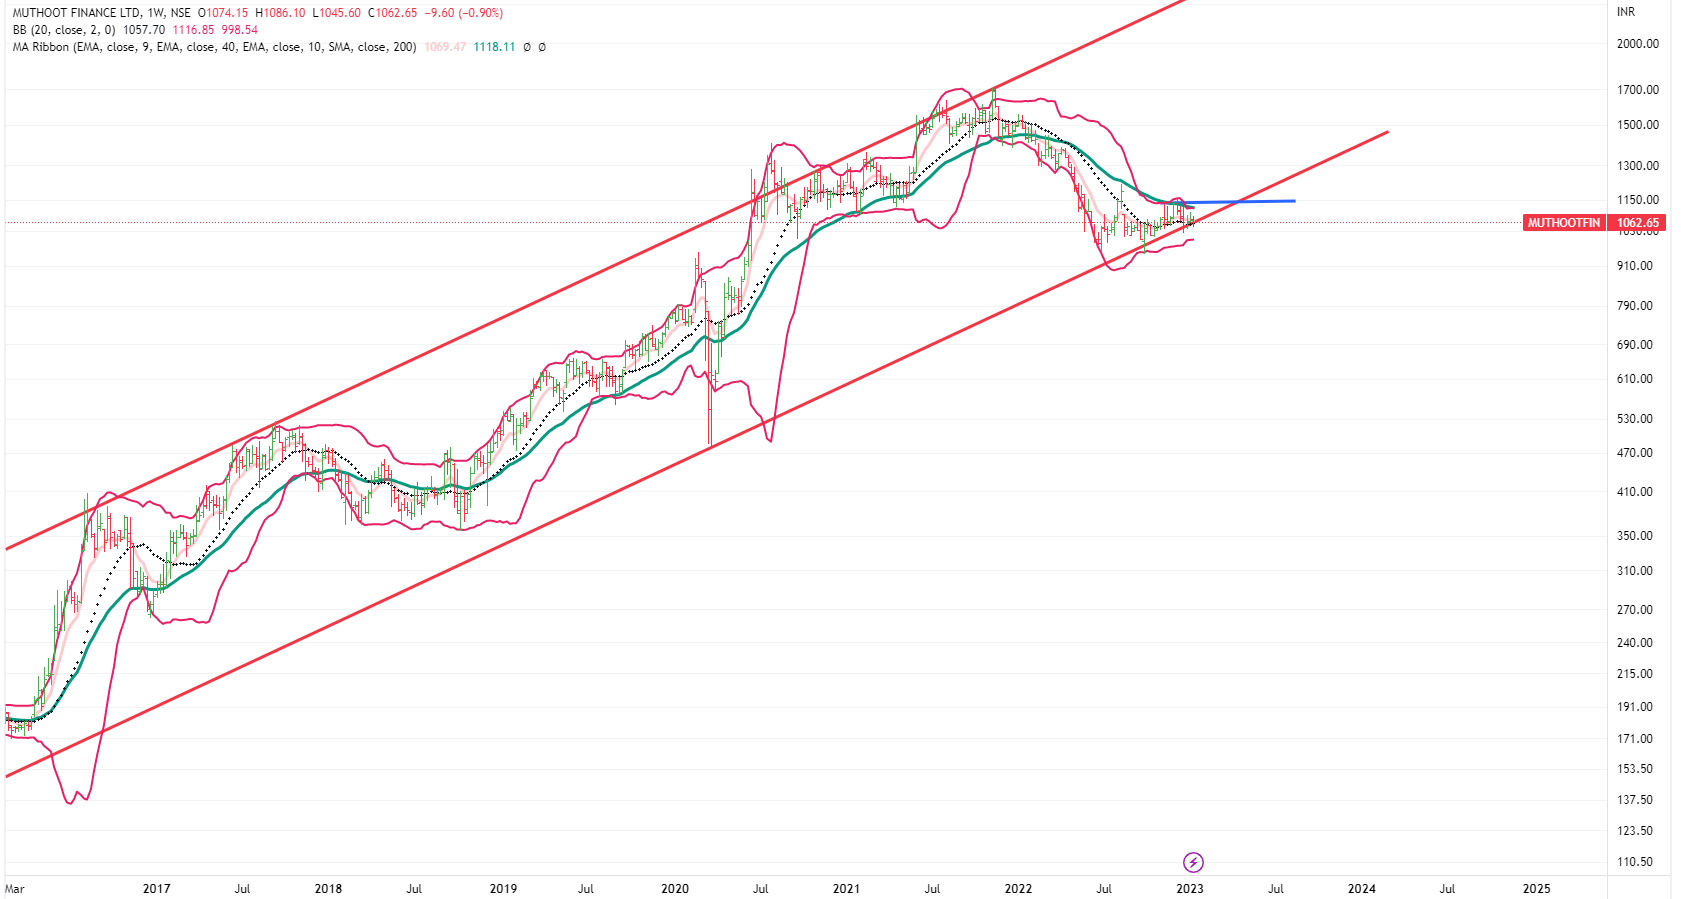
Weekly Charts – here we need to use the Stage Analysis method.
That means the stock should start closing above the 40 weeks moving average and 20 weeks moving average should be looping upwards.
In this case, the price is well below 40 WMA and is hovering near 20 WMA.
It has clear resitance near 1120-1140 range . Crossing and closing above these levels for 1-2 weeks would be the first sign that stock has some upside potential.
Even on daily charts, it is below 20 DMA and 40 DMA.
Daily, Weekly,Monthly MACD are in sell -mode.
Stock is reletively week wrt other NBFCs (laggard in sector )as well as market index.
In short- as of now, it is not showing any indication except that
a) It is near lower end of longer term channel.
b) there is some positive divergence in monthly RSI.
But for anything related to monthly chart take weeks and months to play out.
Disclaimer :This post is just for learning few methods of price-patterns. Views are personal. No buy/sell recommendations. These are probability study methods and chances of success/failure depend upon various factors.
| Subscribe To Our Free Newsletter |
