
Hi – please keep the following points in consideration
a) We analyse charts from long term investing prespective ie for more than 6 months time horizon . We don’t share any views for short term trading ( i.e for a week or for a month)
b) We always encourage our readers to learn Stage -Analysis method . It is very easy to learn and can help a lot if someone is a long term investor. We already shared links to the article in several of our previous posts.
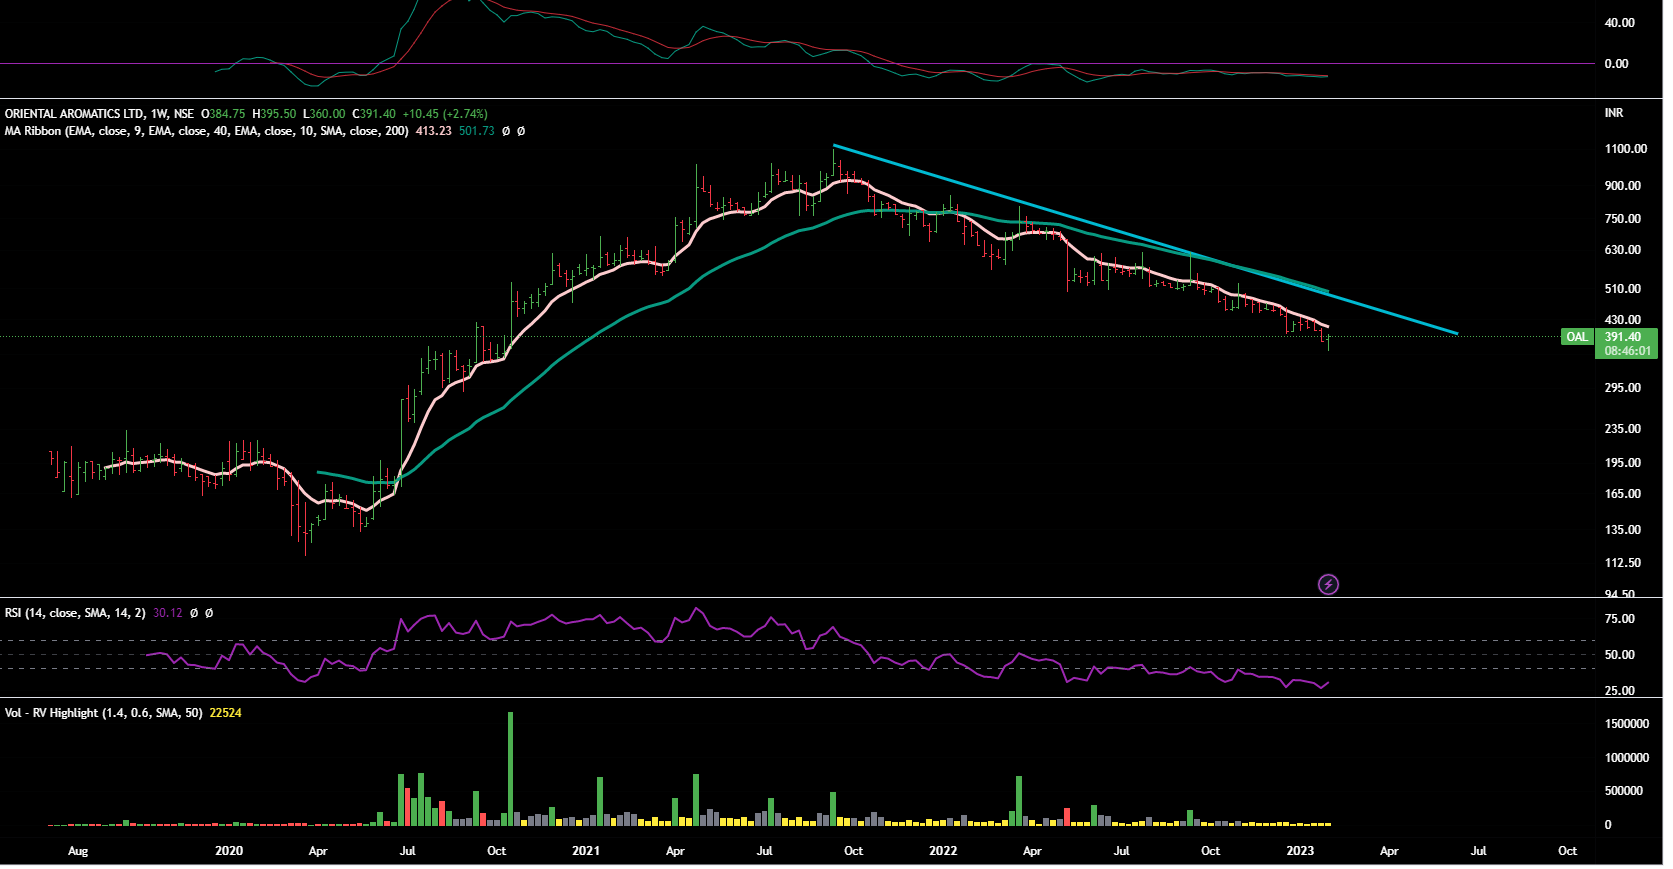
Oriental Aromatics
CMP -391
We don’t see any strength here. It is in Stage 4 . It is difficult to say whether it will stabilise here (best case scenario) or will plunge further.
We won’t touch this stock till it crosses the falling trendline (blue line ). And then we would need more conformations as per stage analysis.
Weekly Chart
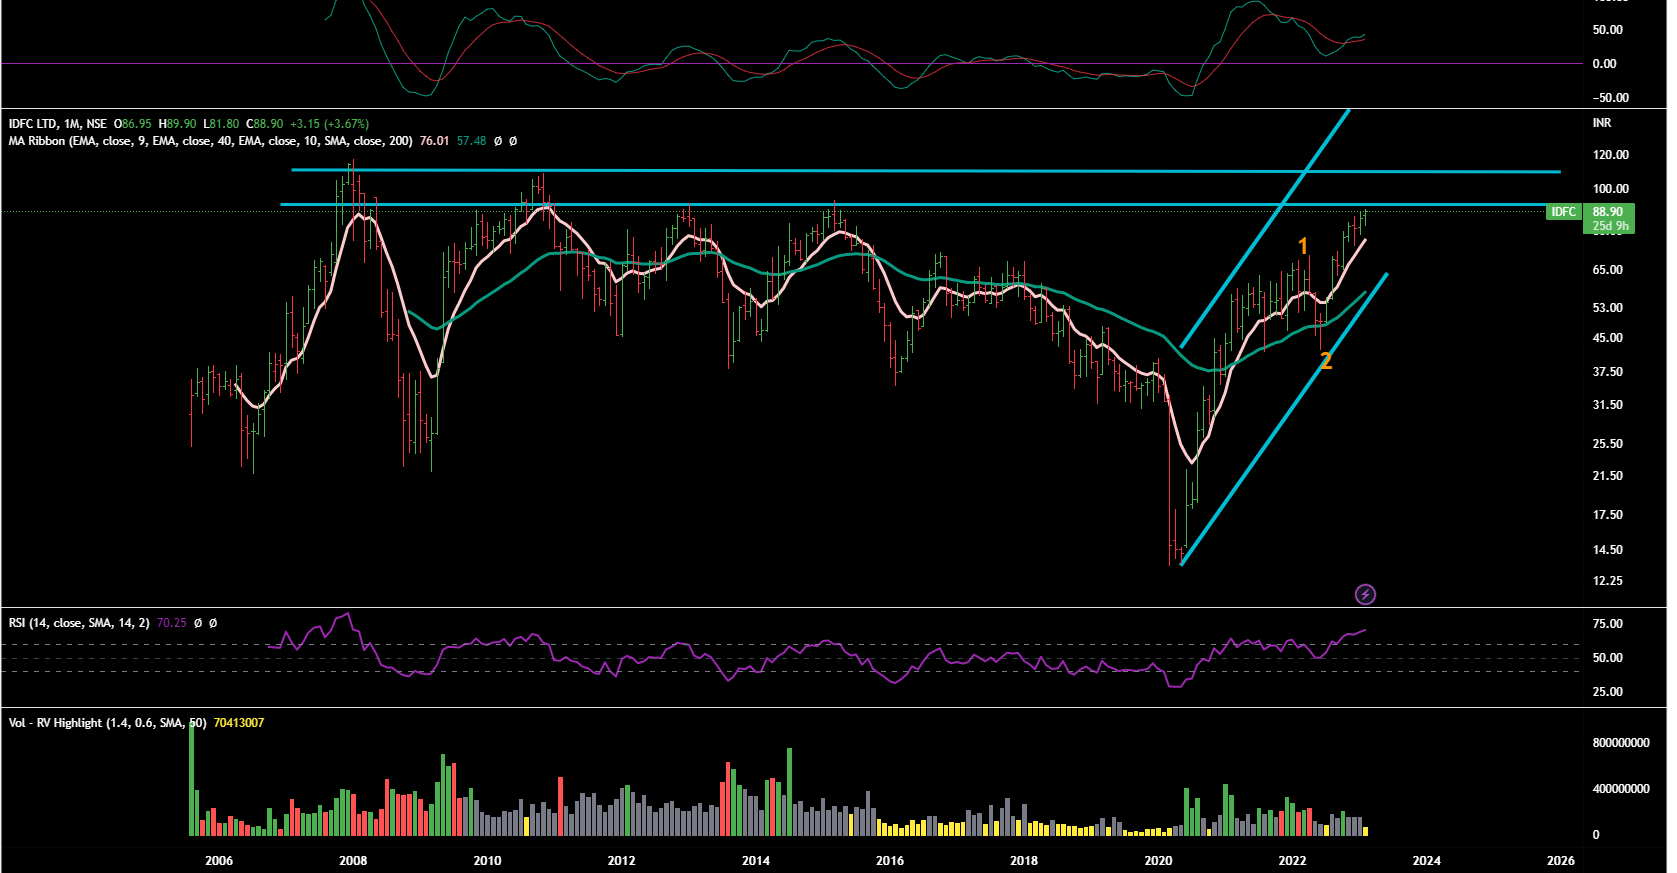
IDFC Ltd
CMP 88
Well the stock is on uptrend .
But it has strong resistances nearby – near 90 and then near 110.
For long term prespective and for bigger gains , it should cross and close above 110-115 range for few weeks.
Monthly Chart
Keep in consideration that weekly/monthly charts projections take few months to play out fully.
Disclaimer :This post is just for learning few methods of price-patterns. Views are personal. No buy/sell recommendations. These are probability study methods and chances of success/failure depend upon various factors.
| Subscribe To Our Free Newsletter |
