
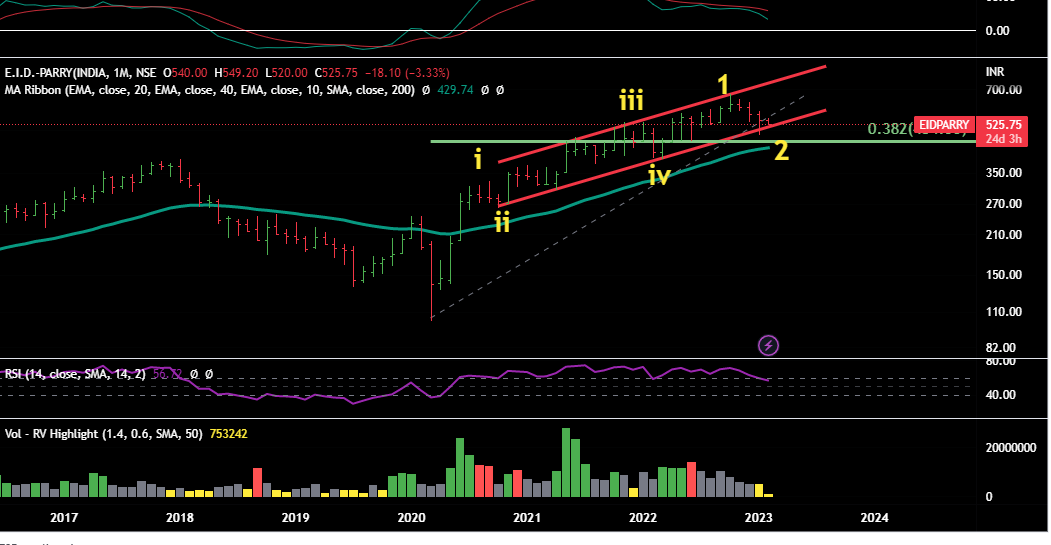
EID Parry
CMP 525
We’re using monthly chart here as it seems to be in wave 2 – the correction phase – also known as Stage 4 .
Very clearly visible as it has broken the parrallel channel that we’ve drawn from bottom of minor wave ii.
Next stop can be near 455 – 38.2% retracement of whole rise from March 2020.
After that it can go to 430 – 40 months moving average.
Now whether it stops there, only time can tell.
Keep in mind that this movement won’t happen very fast as we’re analysing it on montly chart – it would keep moving up and down in coming weeks and months but overall trend is down till wave 2 is over.
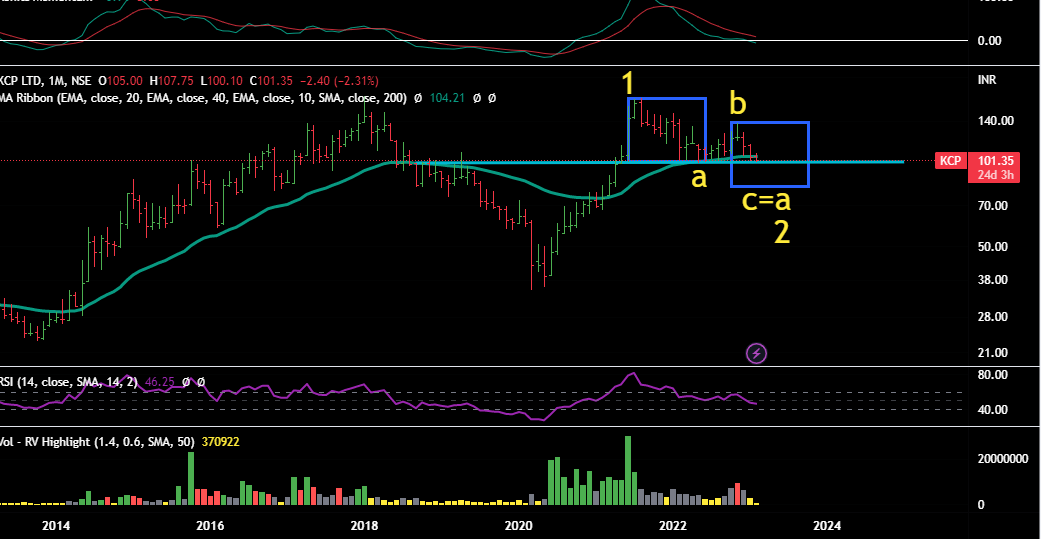
KCP
CMP 101
It is also in Wave 2 – stage 4.
98 is crucial level – most likely it would break .
A=C is near 80 , hopefully it would stop there .But if market conditions are bad, price can go much lower.
Monthly Chart
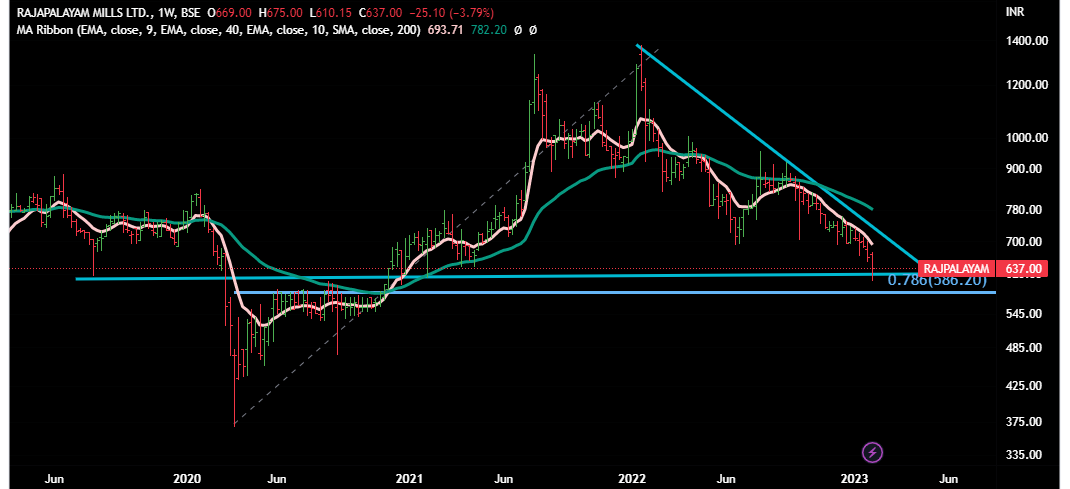
Rajapalayam
CMP 637
It is also in S4 -wave 2 . But it is in oversold zone .
RSI is very low, so it can bounce back a little.
But that does not mean that it can start moving up.
For that it should make a base ,stabilize and volume buying should come.
On downside , 580-90 is strog support zone ( most likely it would come there.)
Weekly Chart
Ramco Industry
CMP 142
Don’t feel need to share the chart. It is in correction area- Stage 4. Can come near to 110.
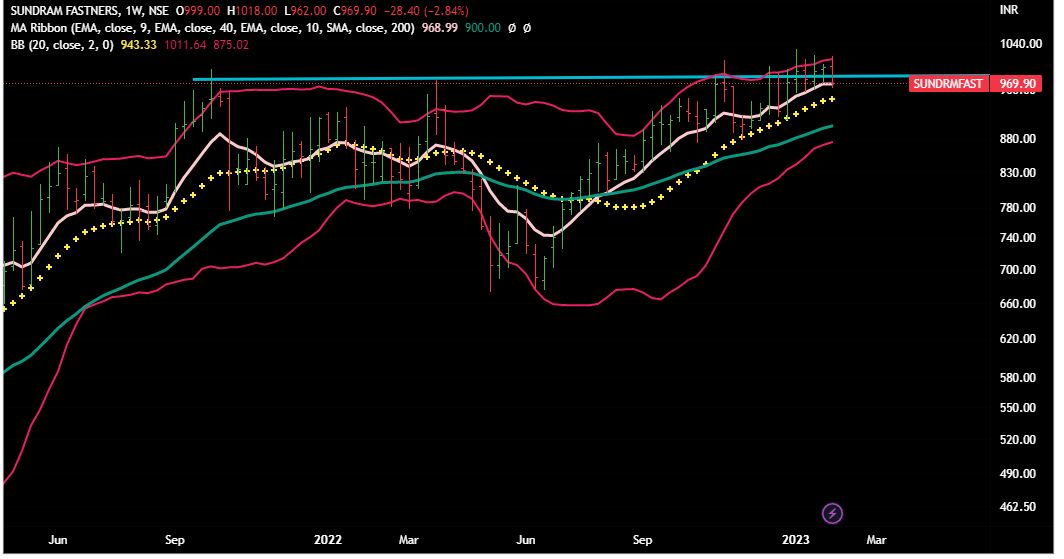
Sundram Fastner
CMP 969
Seems to be in early phase of Stage 2 .
But currently it is struggling near trading-range. Should correct a bit now.
Needs lot of patience here. One needs to wait for it to cross and close above trading-range for few weeks.MACD should go to buy-zone and RSI should get some strength.
Weekly Chart
Disclaimer :This post is just for learning few methods of price-patterns. Views are personal. No buy/sell recommendations. These are probability study methods and chances of success/failure depend upon various factors.
| Subscribe To Our Free Newsletter |
