
Q3, FY-23
-
Revenue Q3 = 444 Cr. which is nearly 10% more YoY (Q3, FY22 = 400 Cr.) and approx.4% lower sequentially.
-
PAT is 9.5 Cr, which is more than YoY and QoQ. Although, PAT in comparison to turnover is not significant however, better than with previous quarters.
-
Forex Loss in this quarter is 4.4 Cr. (YoY forex gain = 6.8 Cr., QoQ forex loss= 12.1 Cr.) which is notional but form part of P/L statement.
-
It appears, Skipper is scaling up polymer product division . ( Profit= 3.5 cr., YoY= 3 Cr., QoQ= 2.8 Cr.). Margins are lower (4.8% operating margin).
-
In their presentation they have shown operating EBITA margin as (excluding forex & JV) 11.2%, which is 100 bps better than YoY (10.2%) and same as YoY ( 11.2%). Operating margin of Engineering segment remains in 13 % range, which of polymer it is 4.8%. Total OPM margin is 10.19%, which is better than previous quarters.
-
Finance cost is heavily eating in their profits. This quarter Interest cost = 25.7 Cr. ( YoY= 22.8 Cr., QoQ= 22.5 Cr.).
-
Skipper-Metzer India LLP JV which is in drip and micro irrigation business has turned profitable. ( PBT 4. 7 cr.)
-
Total Order book as on end of Q3 is 4705 Cr (20% export and 80% domestic orders). They won largest order from BSNL ( 2750 Cr) for supply and erection of Ground based towers and infrastructure, and maintenance for 5 years to be extendable for further 5 years. Capex is 60%, while Opex is 40%. They expect 1542 Cr. revenue in FY 24, 25 ( Capex )and rest 1028 Cr. ( Opex) over next 5 years).
-
Skipper has strong bid pipe line of Rs. 8320 Cr. ( 5200- international, 3120 – domestic). There are many prospective schemes of govt. due to push on infrastructure and FTA with Australia which will benefit company. Company expect to replicate domestic low cost model in international market also.
-
Company expects revenue 25% CAGR for next 3 years, grow export to 50% in FY 23 ( 51% stood in 9MF 23), 75% in FY 24.
Source: Company Results , Investor presentation, Press Release ( Q3 FY 23)
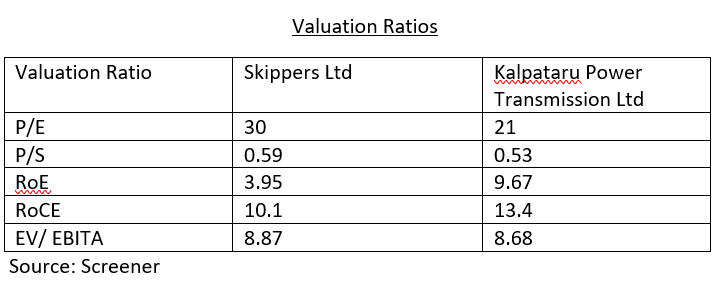
From above it can be seen that company is slowing inching OPM upward, consolidating their position in international market, providing revenue visibility for next few years. However, dependence on PSU orders is till very high, which company needs to reduce. If we compare OPM of Skipper with Kalpataru it is in same range , while better than KEC international. Skipper has to improve on asset turnover ( Skipper=3, KEC=9, Kalpataru=4), and inventory turnover ratios ( Skipper= 1.73, Kalpataru= 6.10, KEC=6.35). Interest cost as % of turnover for skipper is quite high ( Approx. 5.5 % of turnover), while it is 3.1% for KEC international, and 3.5% for Kalpataru. Scaling up business with higher rate, controlling working capital days , and reduction of interest is key to better market capitalization of Company.
Source: Screener
Disclosure: Invested and No transaction of last 30 days
| Subscribe To Our Free Newsletter |
