
Samrat Pharmchem
CMP 612
Every good story either comes to an end or need to have a pause ( you need a sequel).
As per EW, a stock moves up in 5 waves ( these 5 waves constitute larger wave 1) and then enters into correction zone (larger wave 2).
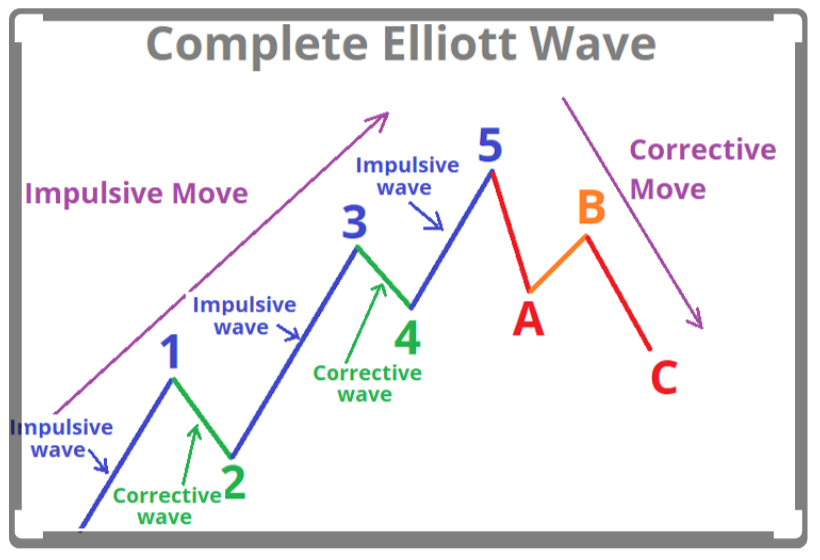
We feel that this stock has now entred in wave 2 ( a deep correction)
Initial stop is near 570 levels – channel low as well as an old support level (blue line)
But we won;t be surprised if it falls further – near to 40 MEMA levels ie near 380-400 levels in coming months.
Monthly Chart

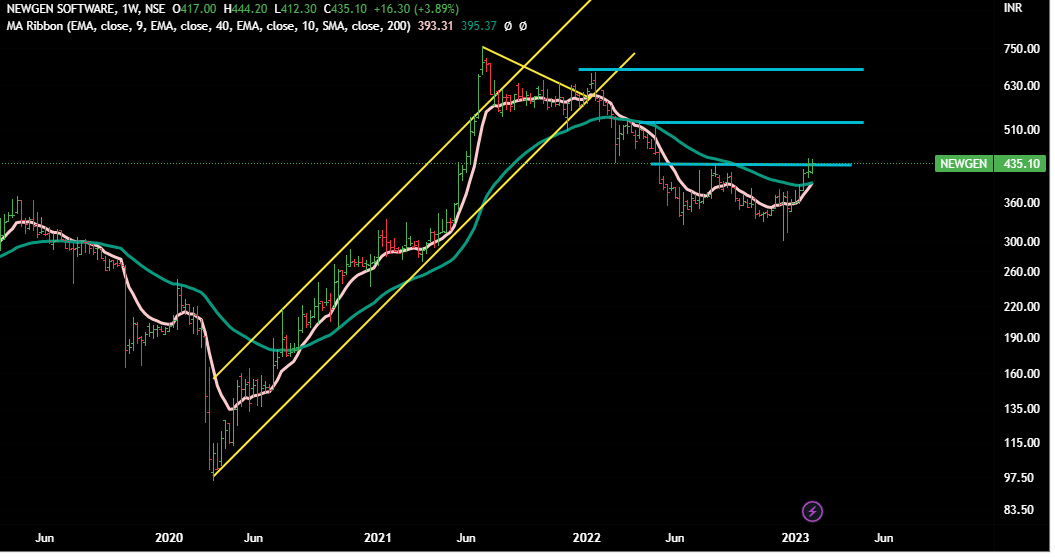
Newgen Soft
CMP 435
It is debatable whether IT stocks have made their final bottom !
As per Stage Analysis , it seems to be entering Stage 2 but we would be cautious here as there are lot of left side resistances – blue -lines.
In these kind of cases , we would add postions in a staggered manner – as the stock crosses and closes above the key resistance levels. But of it start breaking down, we would exit.
In very-very short term, it can correct a bit and can re-test the cirrent trading range breakout level.
Weekly Chart
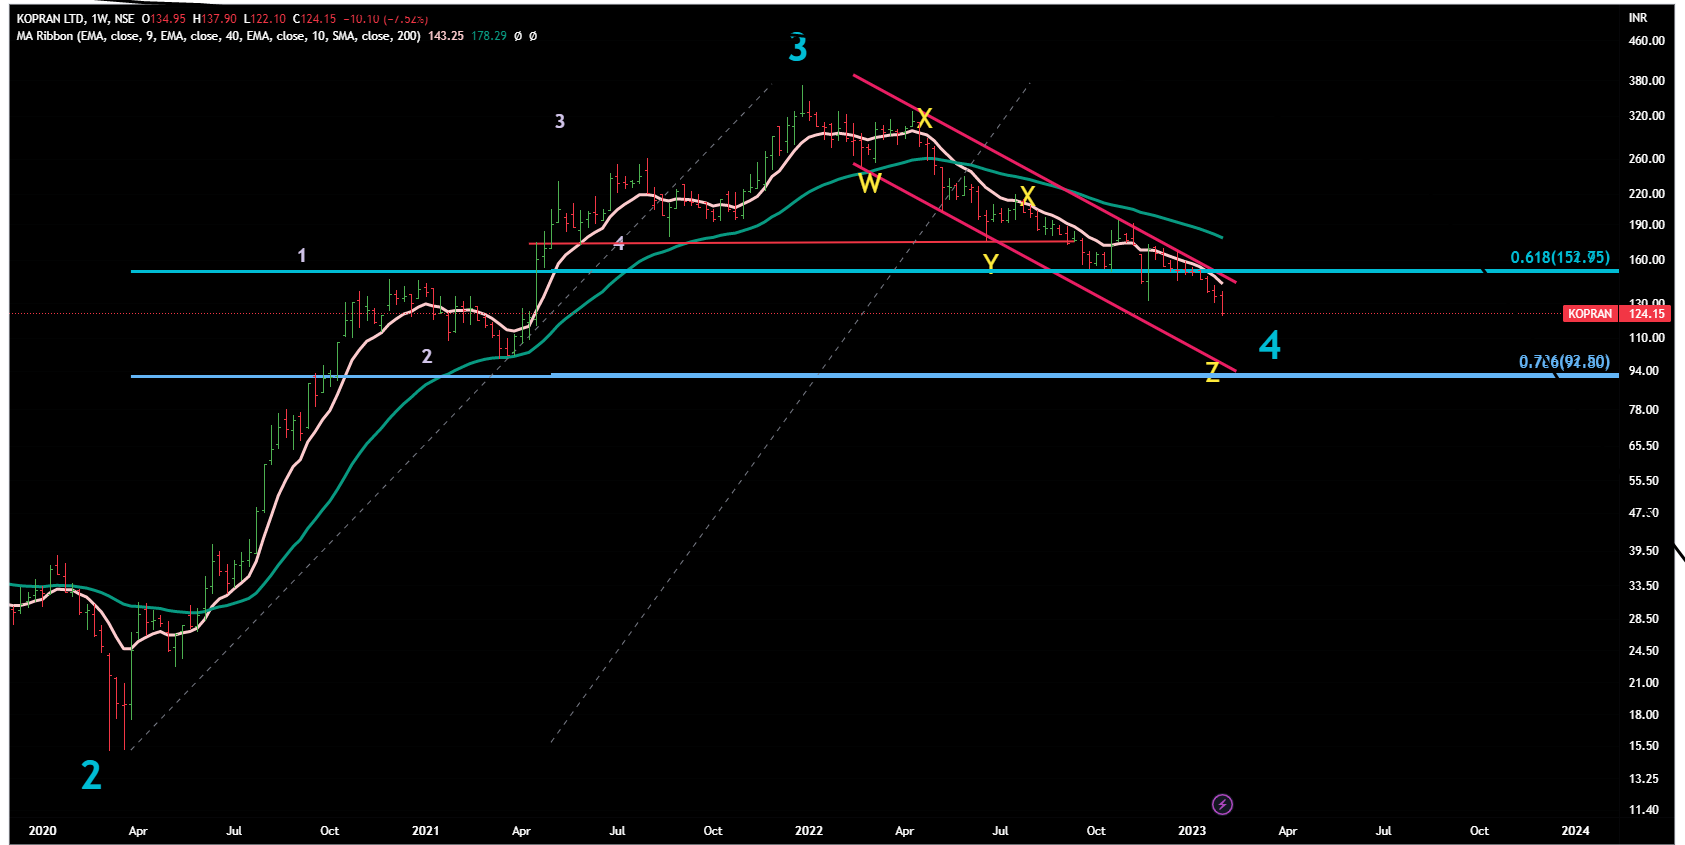
Kopran
CMP 124
Well, this is on an endless spree of breaking- hearts.
Don’t see any sign of stoppage here. Let’s leave it to its own whims and wait .Can correct further.
Weekly Chart
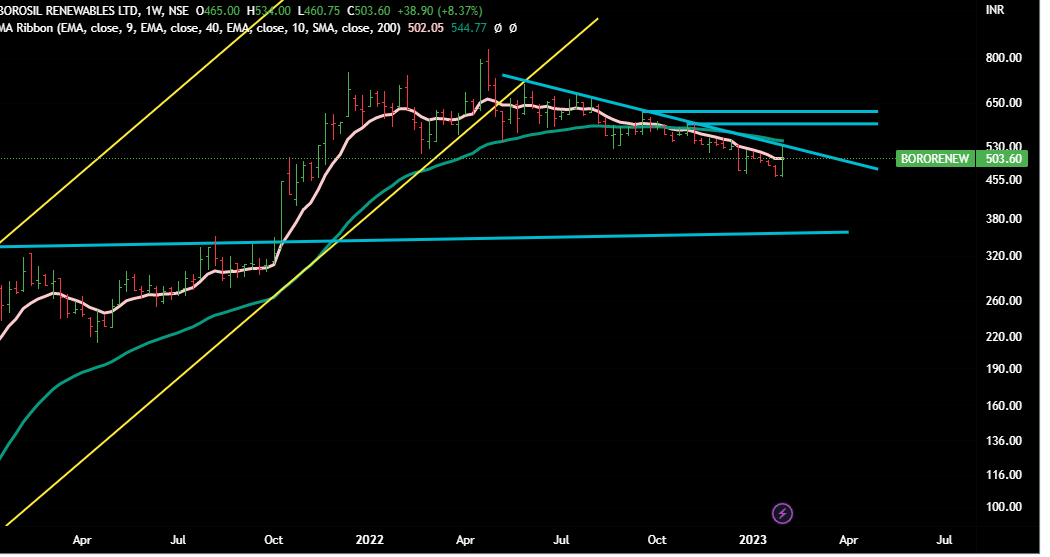
Borosil Renewables
CMP 503
As of now , seems to be correcting.
It is in Stage 4 as per Stage Analysis method.
Has lot of resistances on left hand side.
We would be cautious here because if overall market corrects, then we can see it going down to 400 (even bit lower).
To show any significant upmove, first it needs to cross 590-620 range convincingly.
Weekly Chart
Disclaimer :This post is just for learning few methods of price-patterns. Views are personal. No buy/sell recommendations. These are probability study methods and chances of success/failure depend upon various factors
| Subscribe To Our Free Newsletter |
