
Tejas Network
CMP 557
Majority of juice has been taken out -stock went from 30 to 770.
One leg of upmove might come in future.
But when?
Well, you can help yourself.
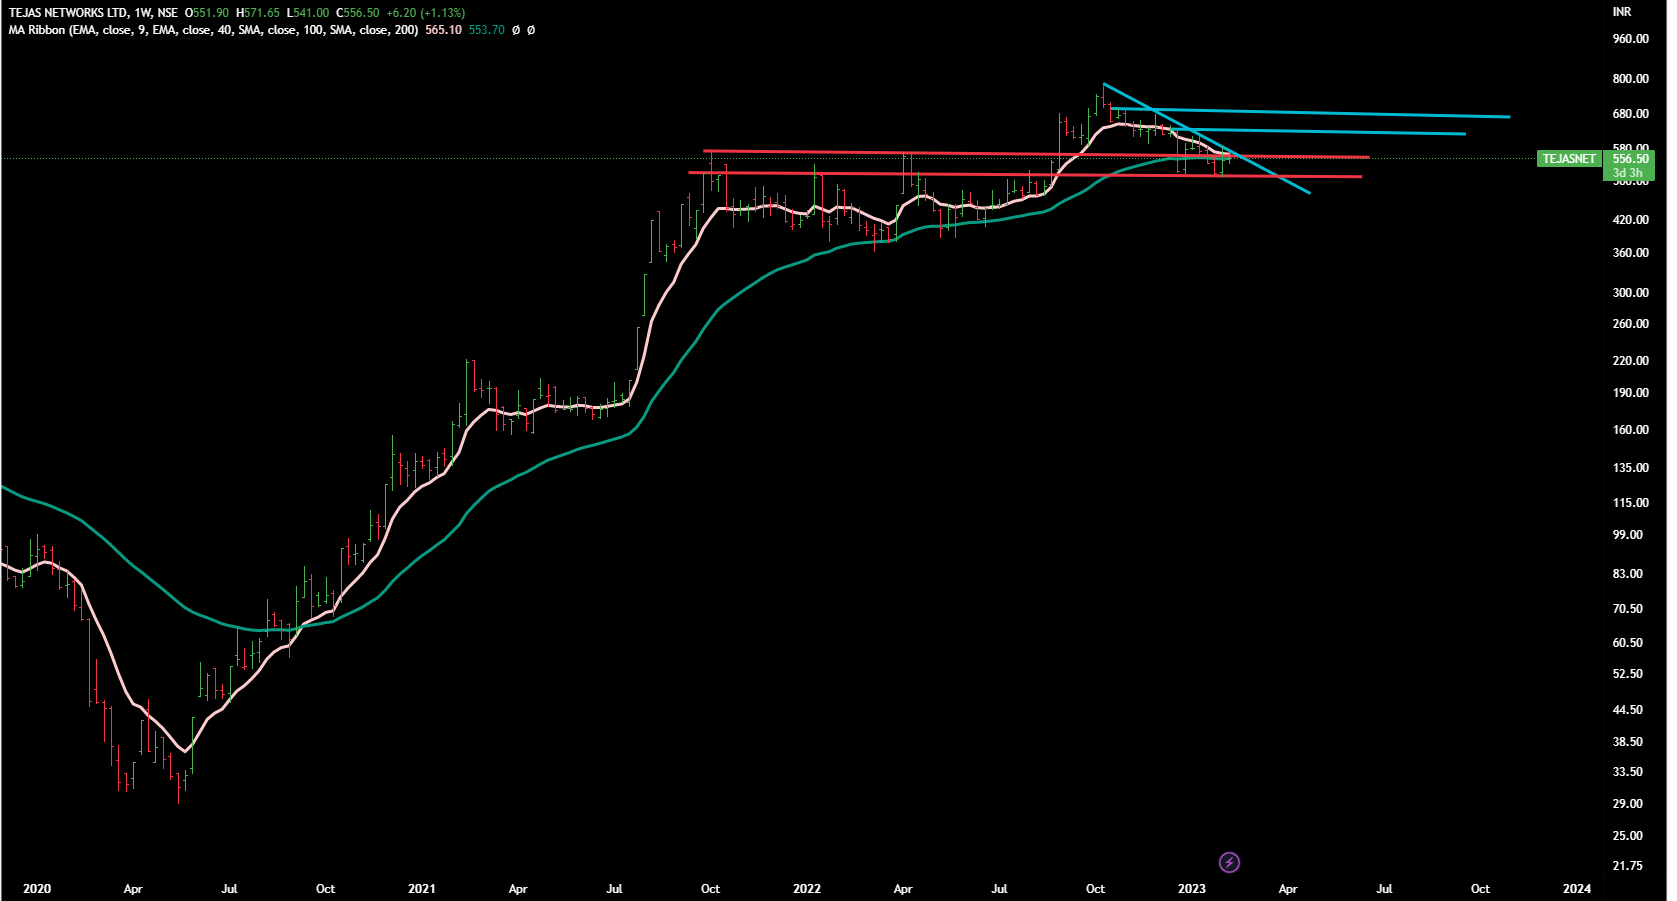
Draw these 5 lines on your weekly chart – 3 blue, 2 red.
In these kind of extended stocks, we always go for pyramiding.
When the price crosses/closes above the 1st tilted blue line, one can add small position. And when price crosses/closes above the horizontal blue lines, one can keep adding to the positions . Last postion should be added once the price crosses all time high.
Red lines show a trading zone -nothing would happen in this except rangebound movement. But if someone is holding and price starts closing below the lower red -line, sell and run away.
Weekly Chart
Disclaimer :This post is just for learning few methods of price-patterns. Views are personal. No buy/sell recommendations. These are probability study methods and chances of success/failure depend upon various factors.
| Subscribe To Our Free Newsletter |
